TikTok Stats 2023 for a top-notch marketing strategy
TikTok statistics for 2023, including metrics like engagement, views and usage
TikTok - Video view rate by number of followers
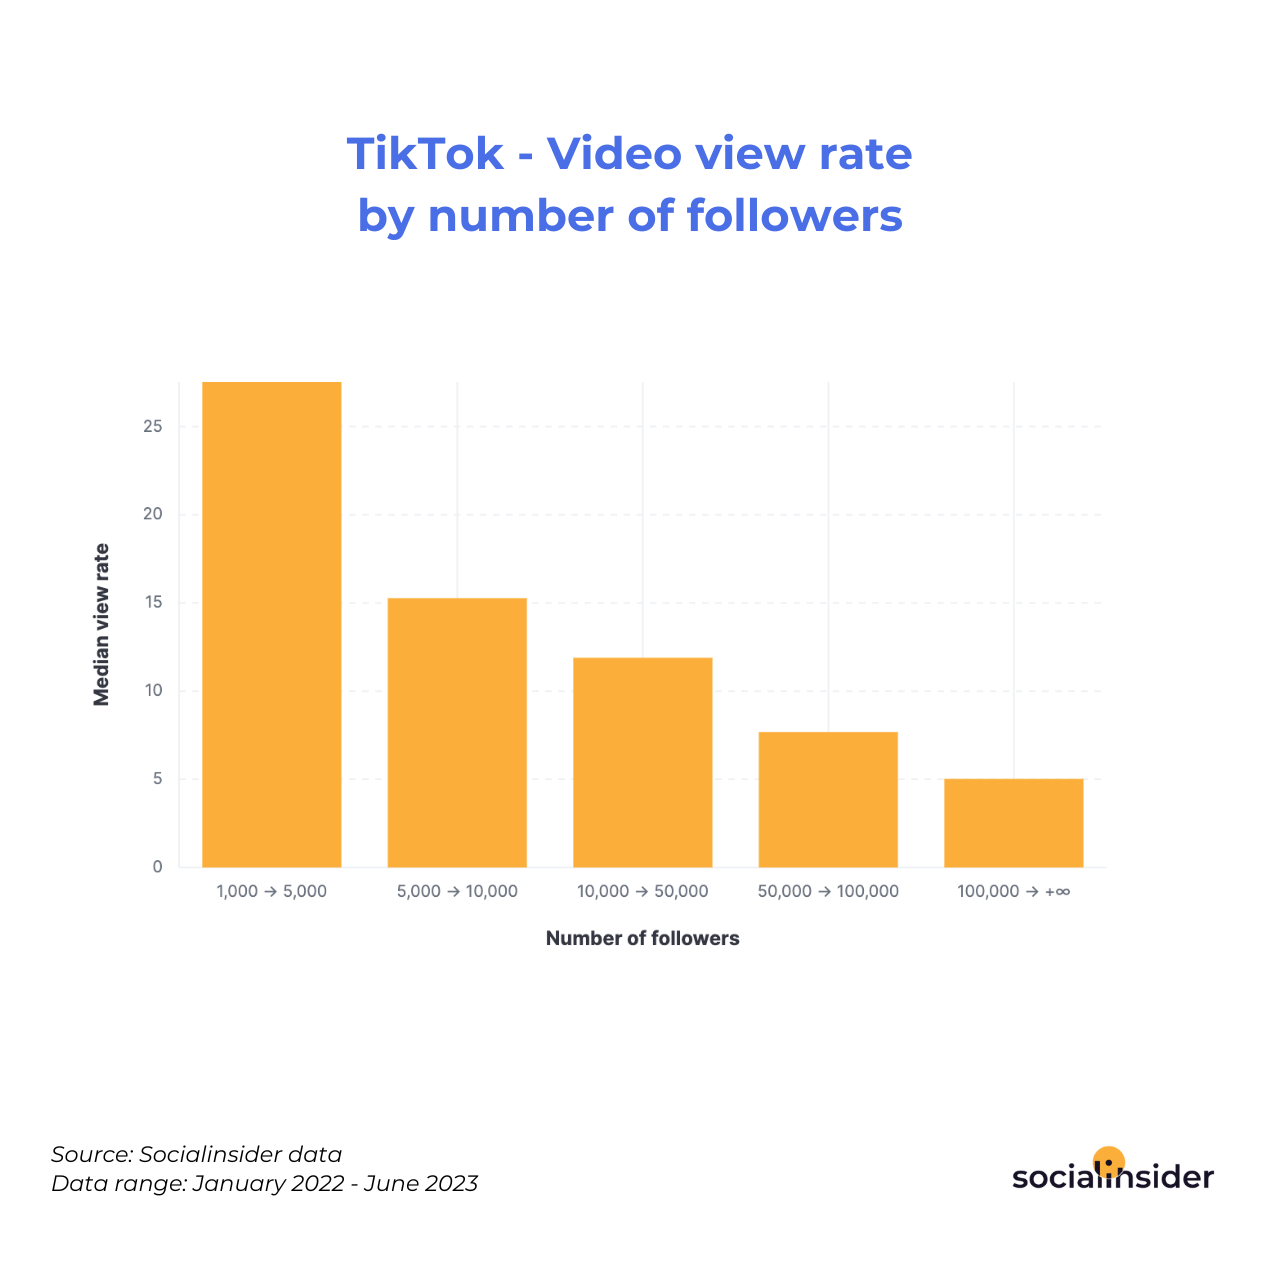
TikTok video statistics indicate that the view rate for TikTok videos is higher for accounts with a follower count between 1.000 - 5.000.
TikTok videos from accounts with a follower count between 1.000 - 5.000 have a higher median view rate, indicating 28. TikTok videos from accounts with a follower count higher than 100.000 have a median view rate of 5.
Download
TikTok - Average watch rate by number of followers
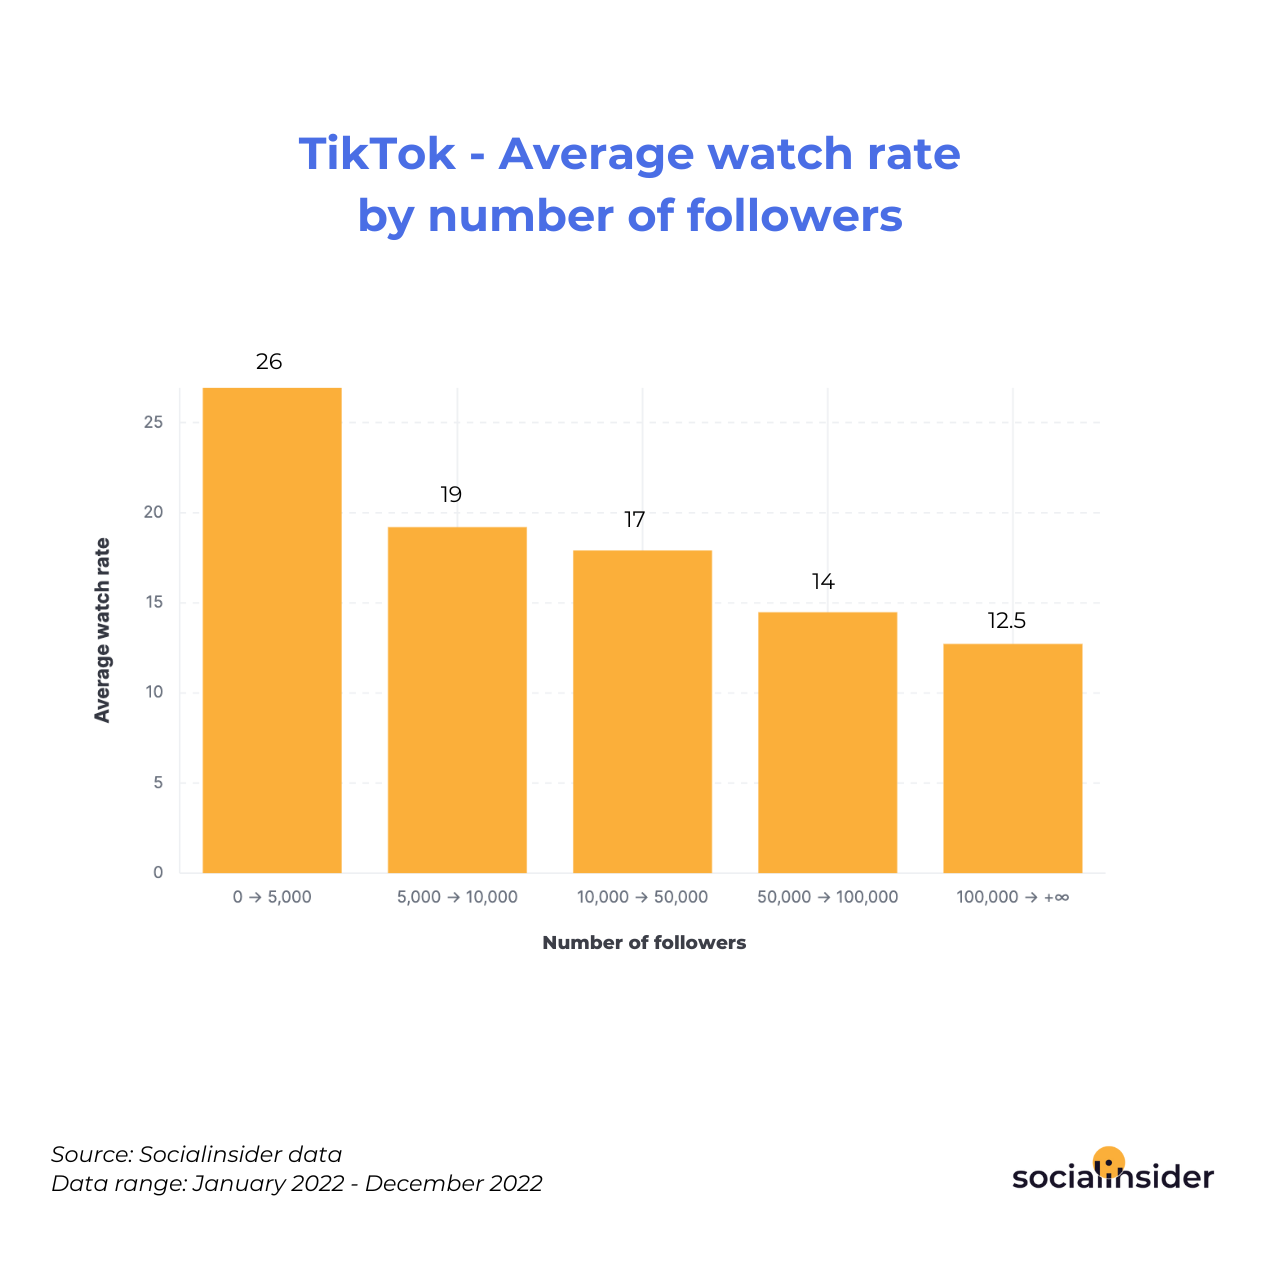
On TikTok, the average watch rate is the highest for the profiles with the lowest follower count, between 0 - 5.000.
The highest value for the average watch rate on TikTok is 26%, for the accounts with a number of followers between 0 - 5.000. The lowest value for the average watch rate on TikTok is 12.5% for profiles with a follower count of 100.000 or more.
Download
TikTok - Average watch rate by mention presence by number of followers
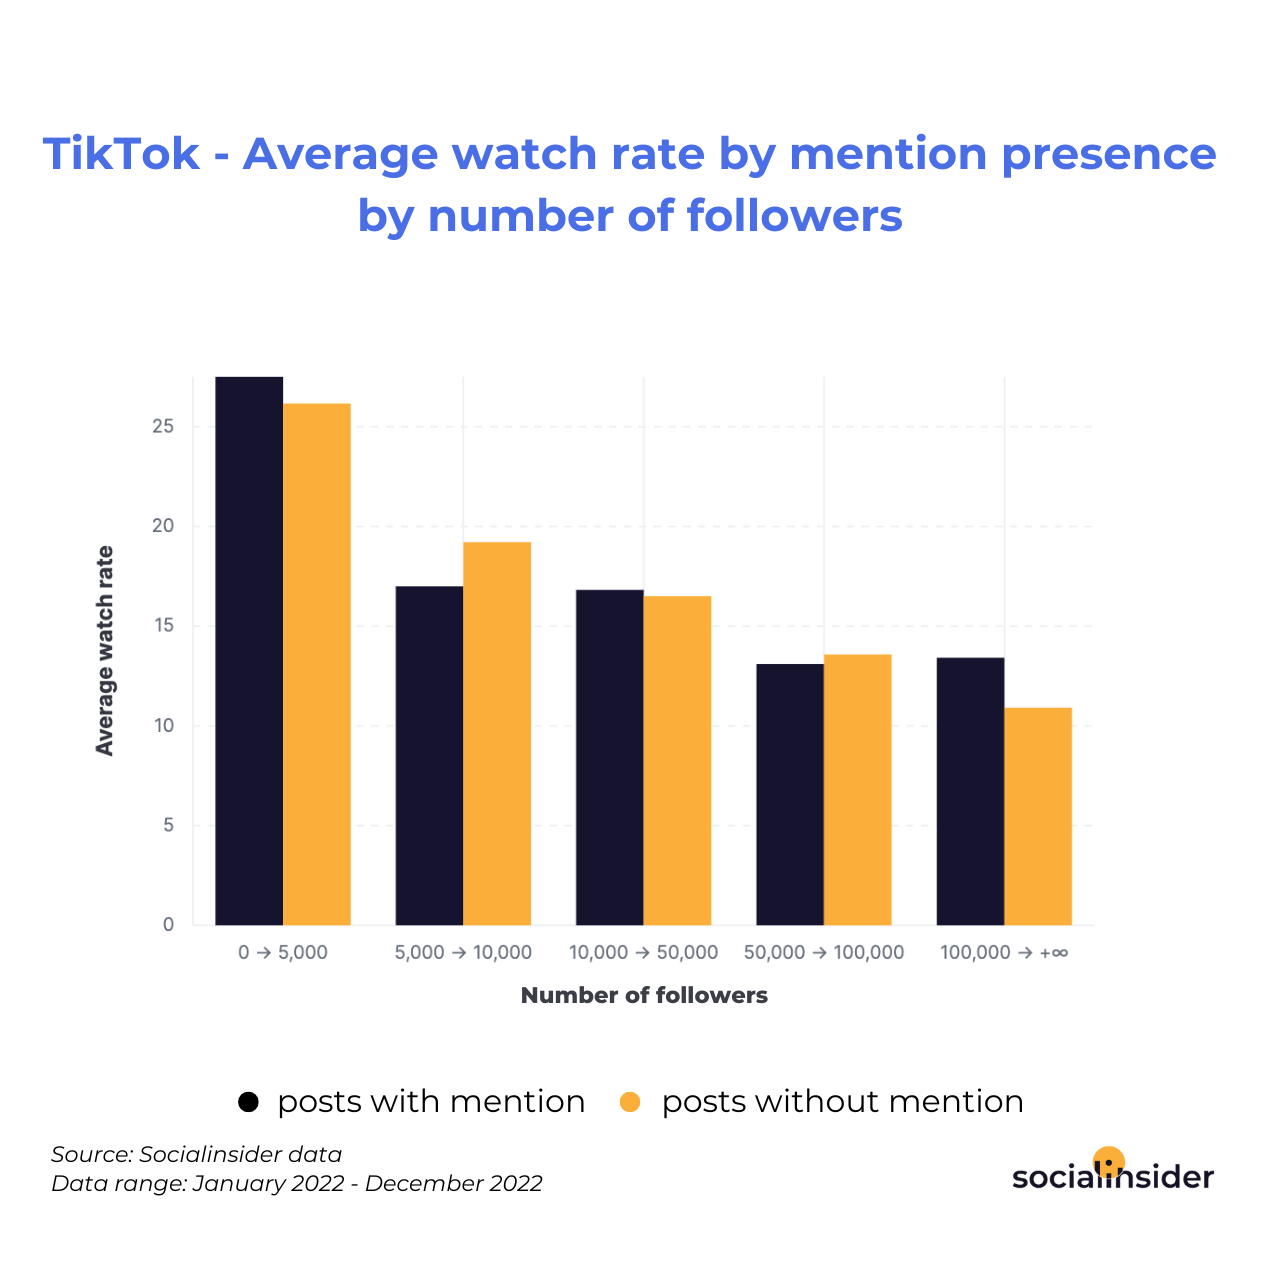
The average watch rate by mention presence for TikTok is the highest for the profiles with the lower count on followers.
The highest average watch rate by mention presence is 27.5% for posts that use mentions, for accounts with a number of followers between 0 - 5.000. The lowest average watch rate is 11% for posts without mentions and for profiles that have a follower count of 100.000 or more.
Download
TikTok - Average video view rate by original vs non-original sound by number of followers
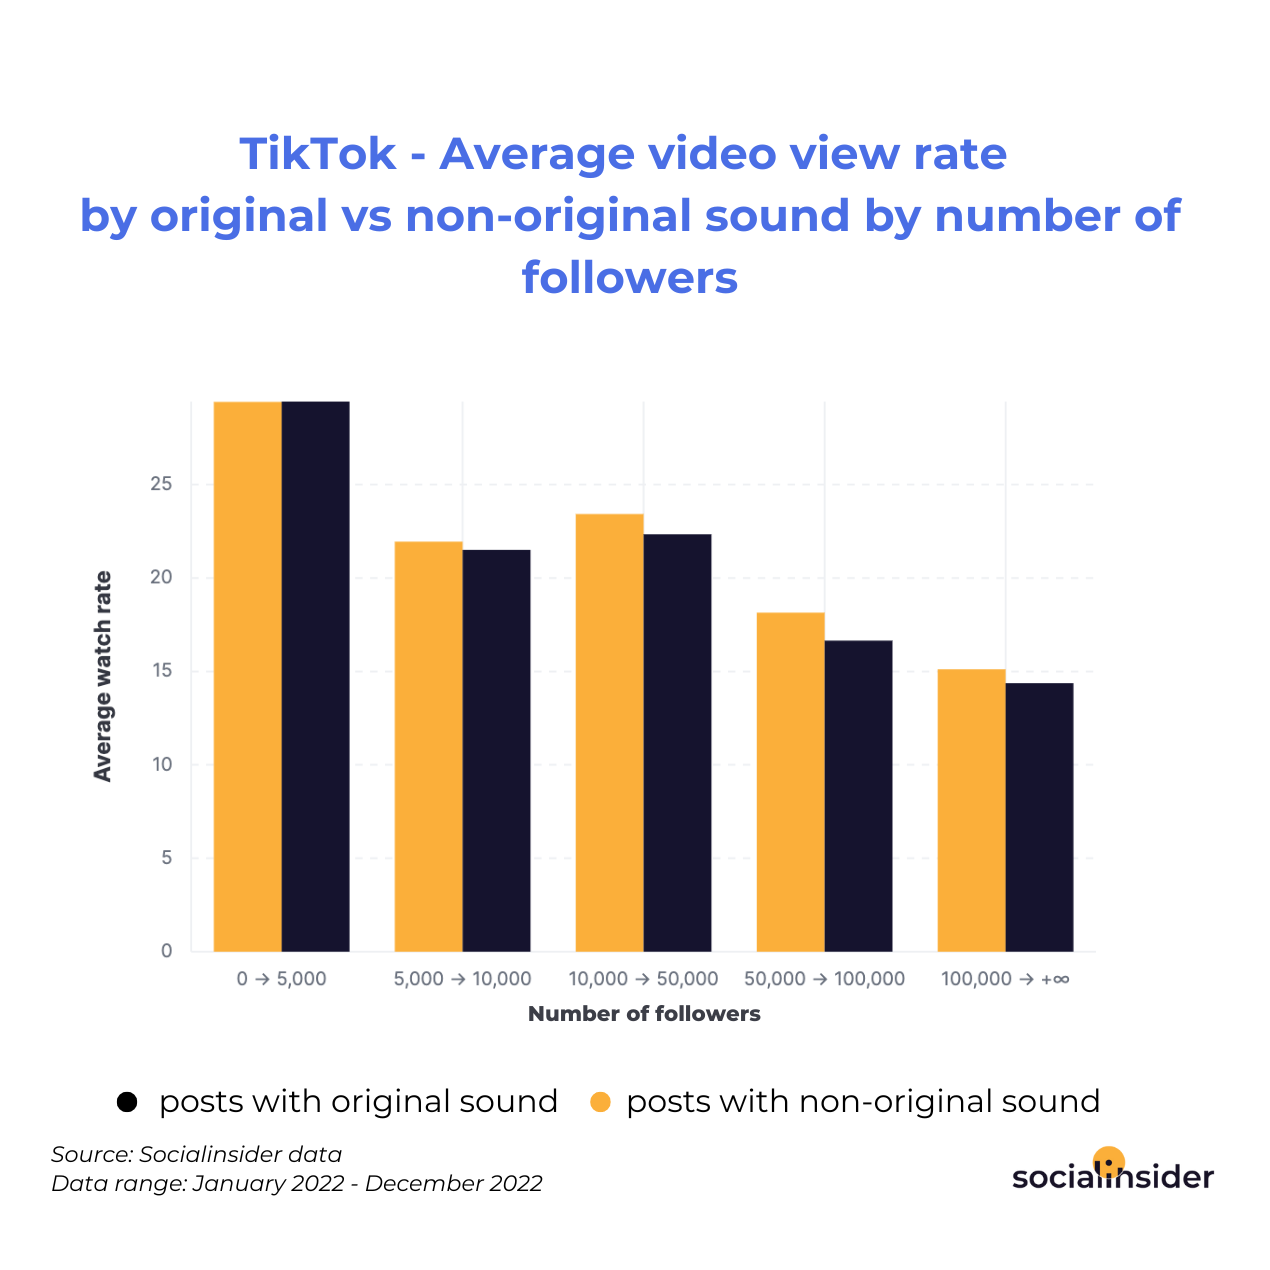
The average video view rate by original vs non-original sound varies depending on the number of followers for the accounts.
The highest value for the average video view rate by original vs non-original sound is 30% for both those that use or use not an original sound, for profiles with a follower count ranging from 0 to 5.000. The lowest value for the average video view rate on TikTok depending on the sound used is in the case of accounts with higher follower count (100.000 or more), indicating 15%.
Download
TikTok - Average engagement rate by video views per top industries
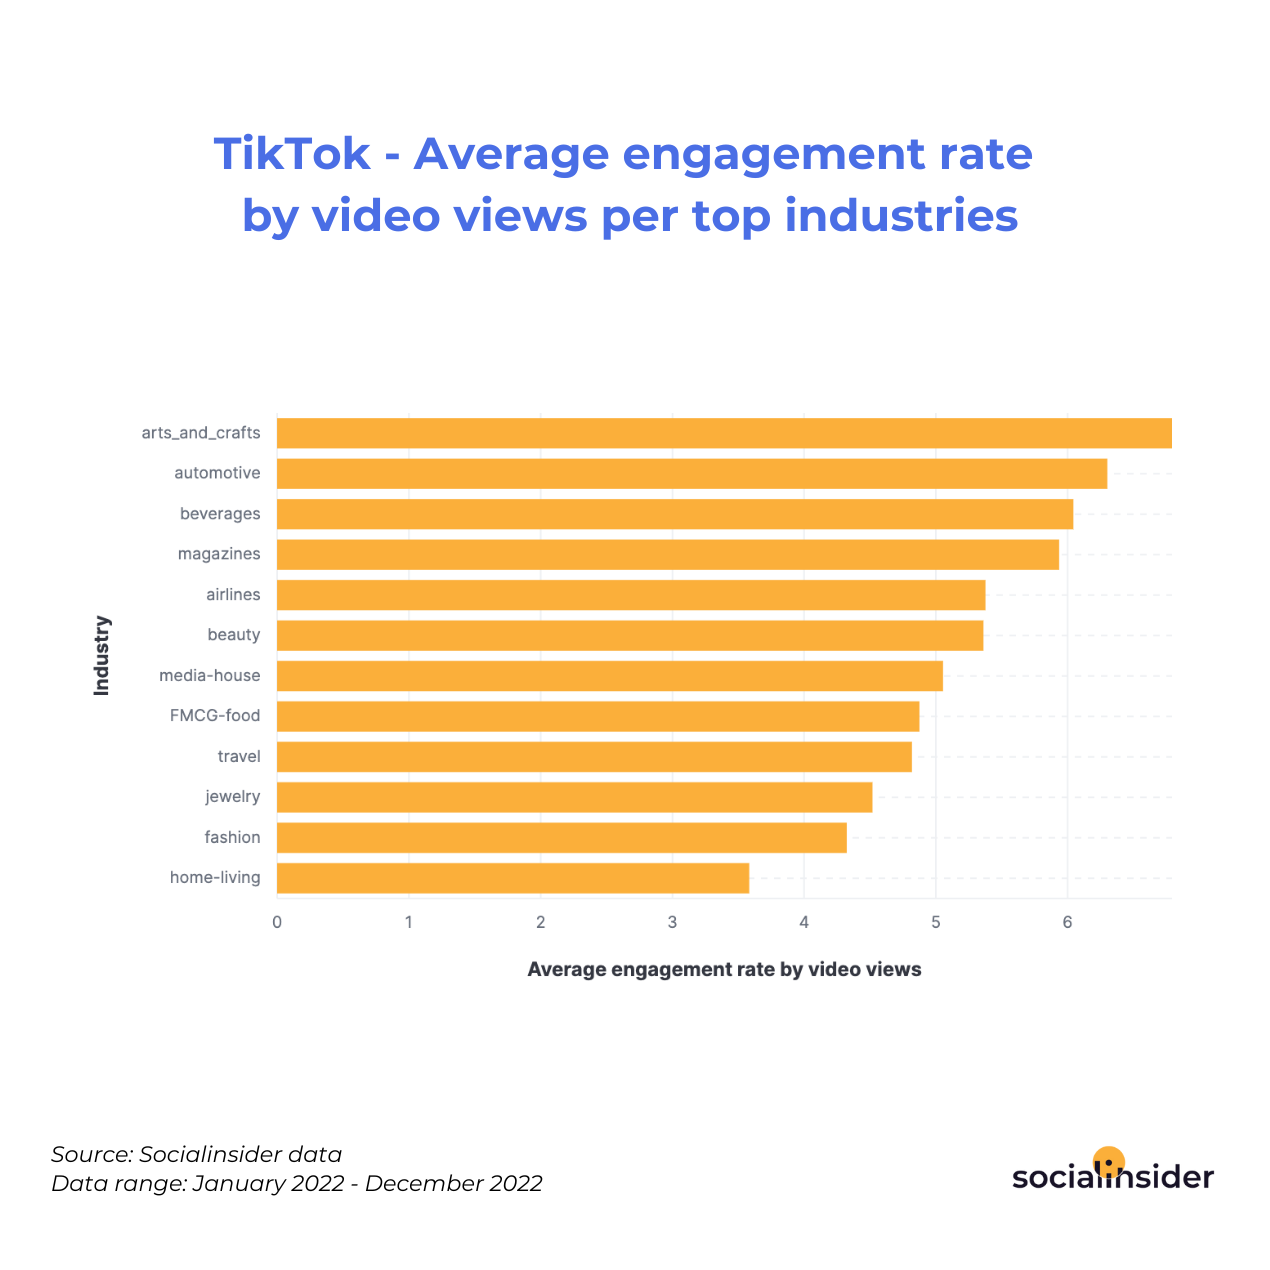
The average engagement rate by video views on TikTok varies a lot for all top 12 industries, 3.6% to 7%.
The highest value for the average engagement rate by video views on TikTok was recorded for the Arts & crafts industry, indicating 7%. At the other end, the lowest average engagement rate by video views was recorded for the Home & living industry, with 3.6%.
Download
TikTok - Age Demographics for UK
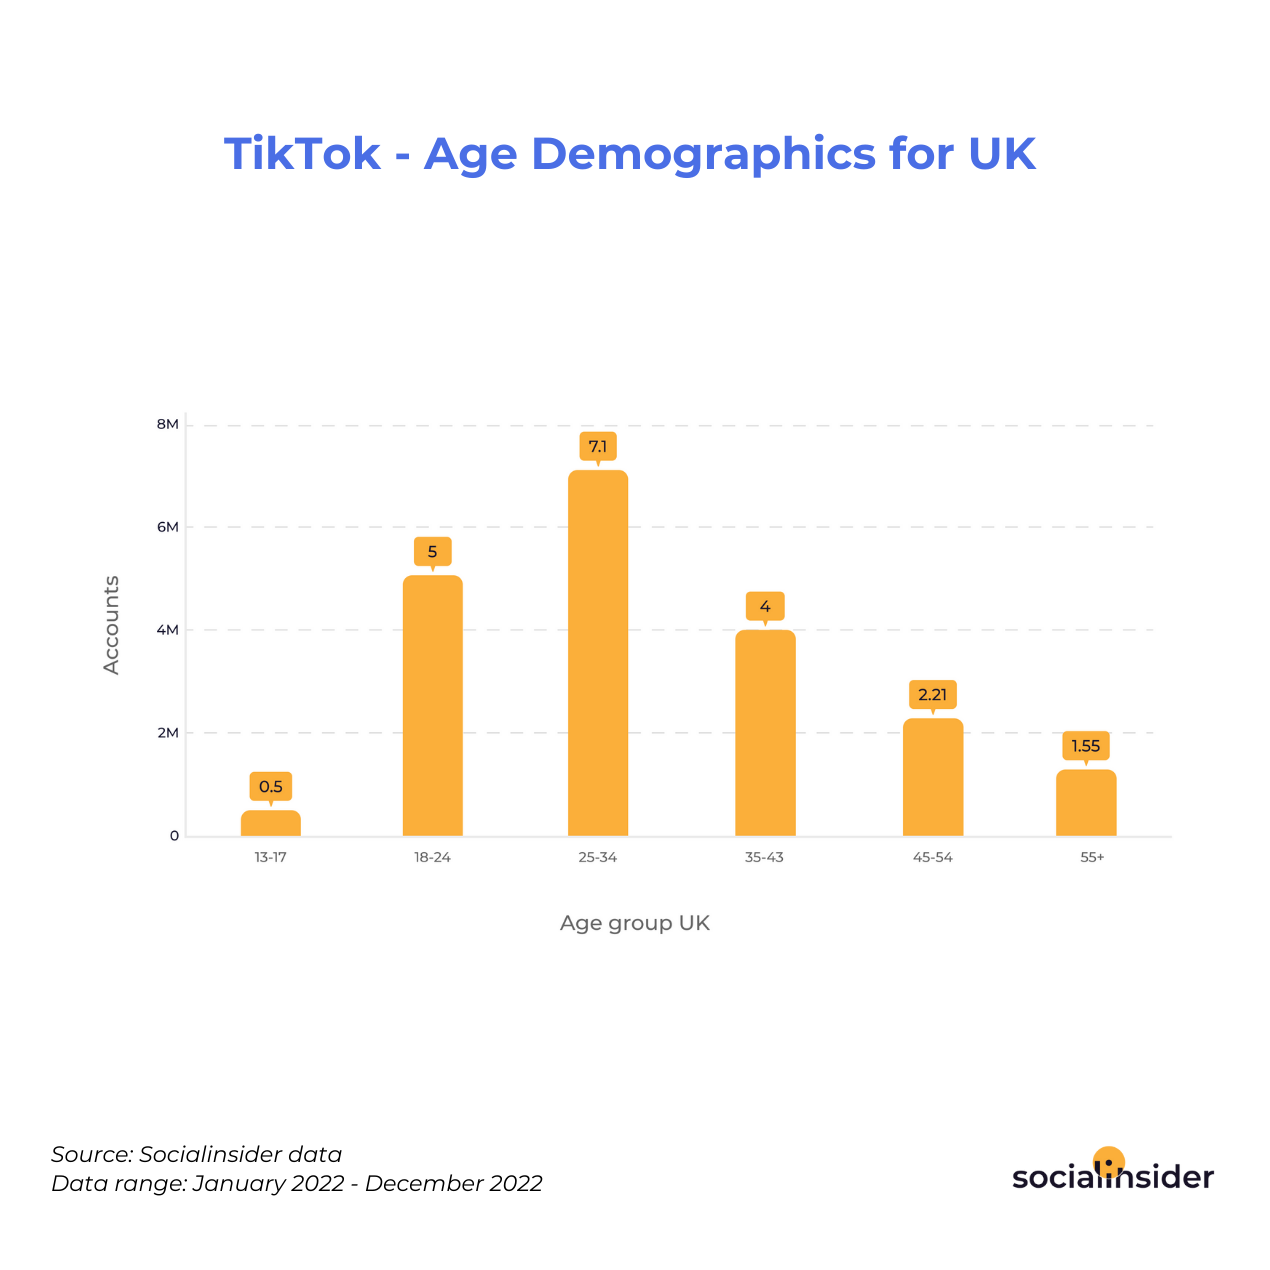
On TikTok, the age group that has the most accounts is the one between 25-34 years old.
The age group with the highest number of TikTok accounts is the one between 25-34 years old, indicating 7.1 million users. The age group with the lowest number of TikTok accounts is the one between 13-17 years of age, with a value of 0.5 millions.
Download
TikTok - Age Demographics for UAE
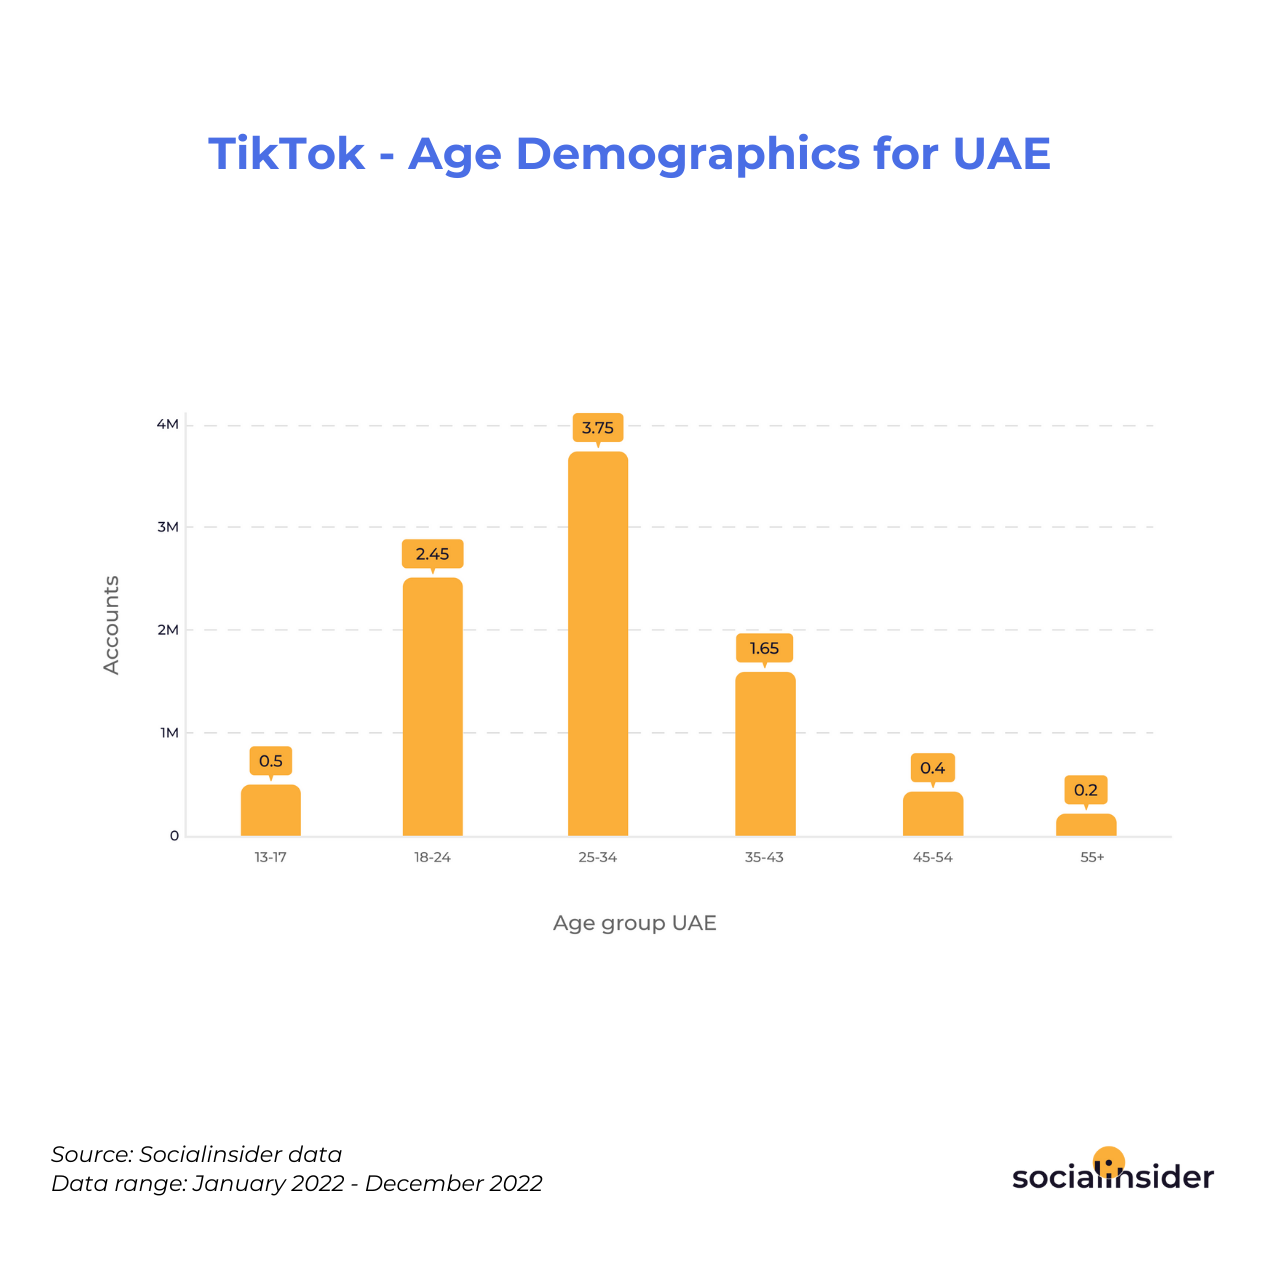
In the UAE, on TikTok, the age group that has the most accounts is the one between 25-34 years old.
The highest number of TikTok accounts is registered for the age group 25-34 years old, indicating 3.75 millions. At the other end, the lowest number of TikTok accounts in the UAE is registered for the age group over 55 years of age, with a value of 0.2 million users.
Download
TikTok - Age Demographics for USA
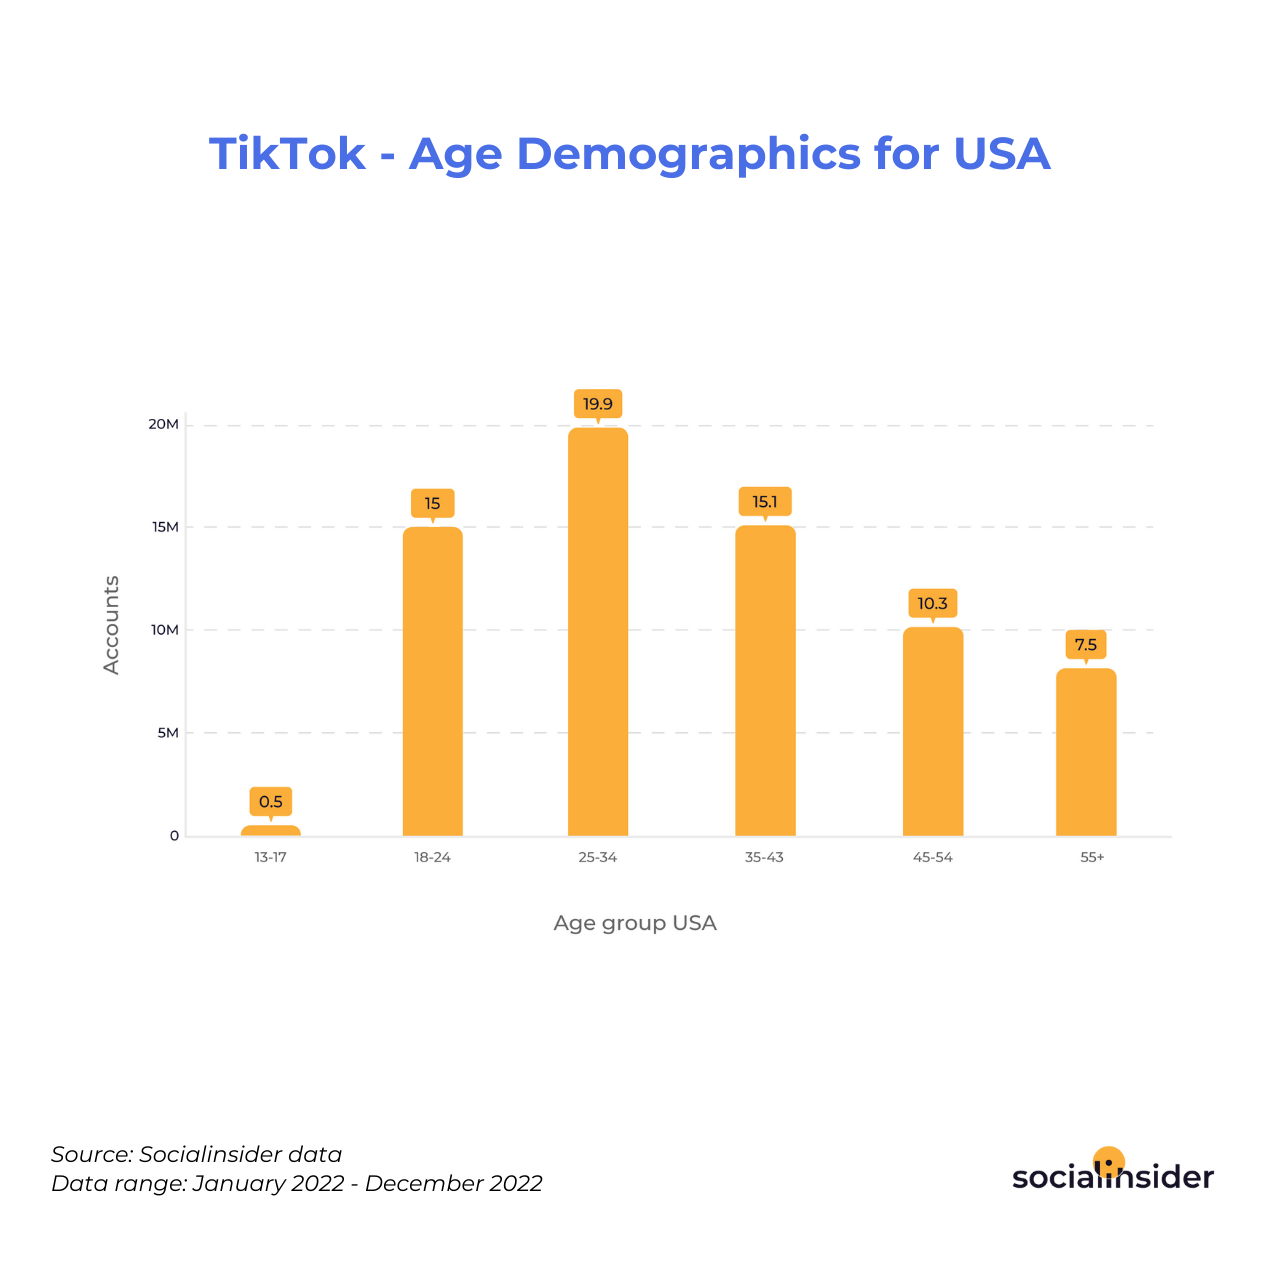
In USA, on TikTok, the age group that has the most accounts is the one between 25-34 years old.
The age group that indicates the lowest number of TikTok accounts is the one between 13-17 years old, with a value of 0.5 millions. The age group between 25-34 years of age shows the highest number of TikTok accounts, indicating 19.9 million users.
Download
TikTok - Age Demographics for Indonesia
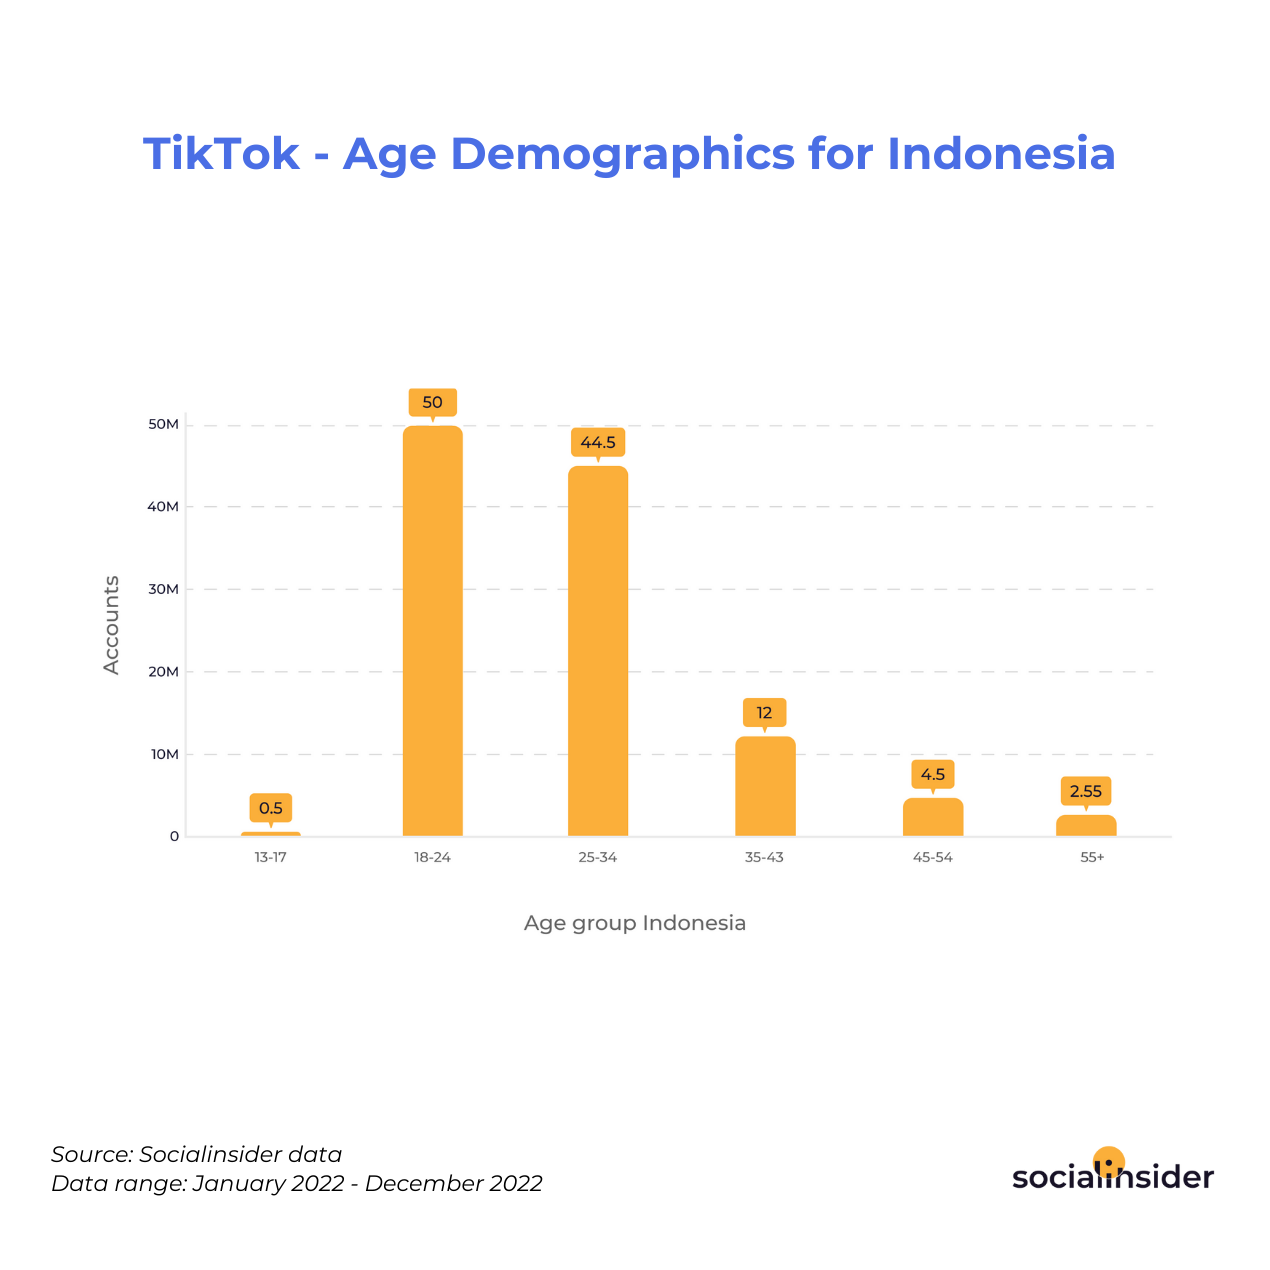
In Indonesia, on TikTok, the age group that has the most accounts is the one between 18-24 years old.
The age group between 18-24 years old represents the highest number of TikTok accounts, with a value of 50 million users. The lowest number of TikTok accounts is for the age group between 13-17 years of age, indicating 0.5 millions.
Download
TikTok - Gender Demographics for Indonesia
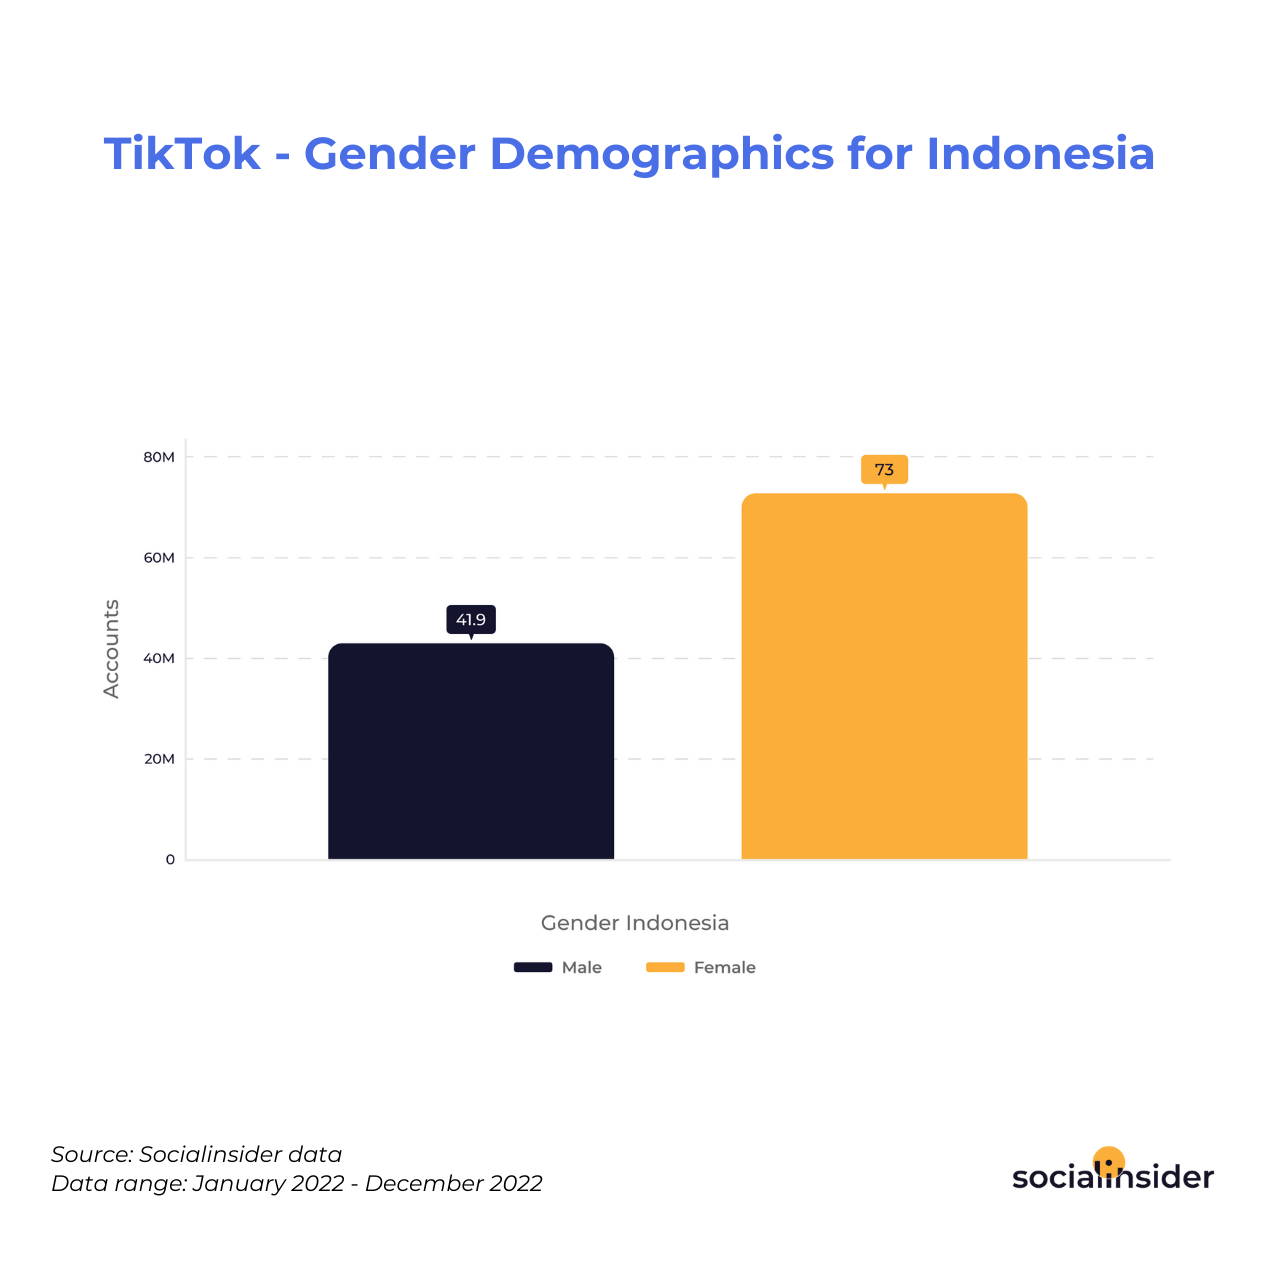
In Indonesia, for TikTok, the highest number of accounts by gender is represented by females.
Females represent the highest number of TikTok accounts by gender, indicating a value of 73 million users. Males only have 41.9 million accounts on TikTok in Indonesia.
Download
TikTok - Gender Demographics for USA
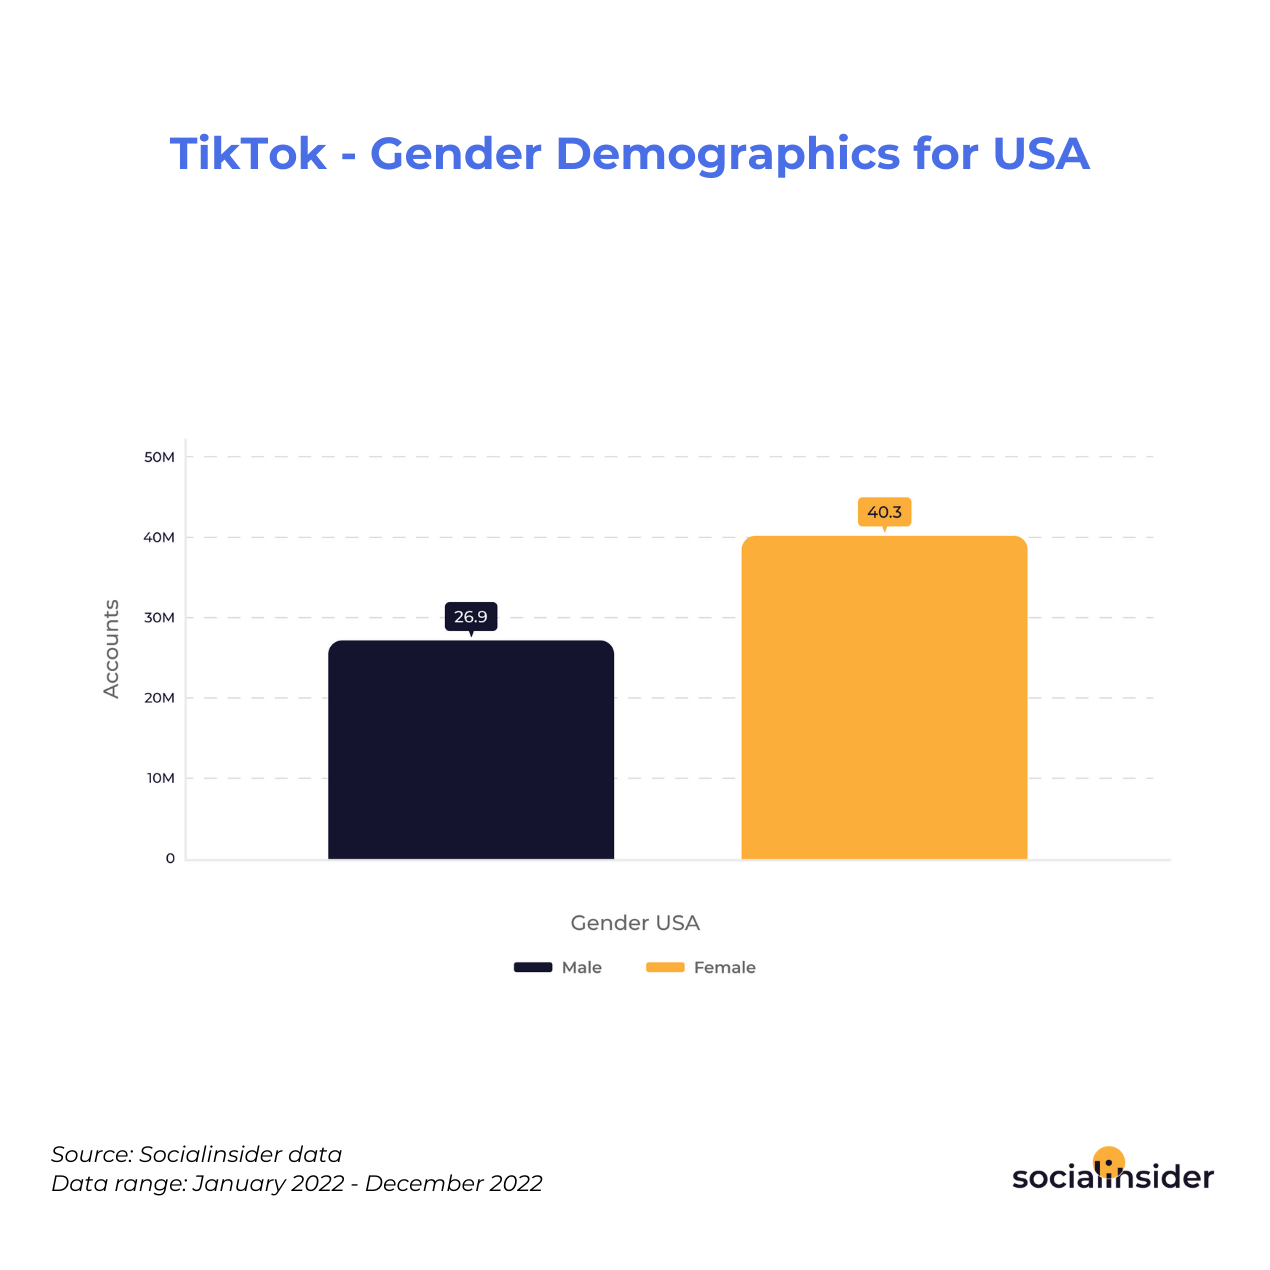
In USA, for TikTok, the highest number of accounts by gender is represented by females.
Females represent the highest number of TikTok accounts by gender, indicating a value of 40.3 million users. Males only have 26.9 million accounts on TikTok in USA.
Download
TikTok - Gender Demographics for UAE
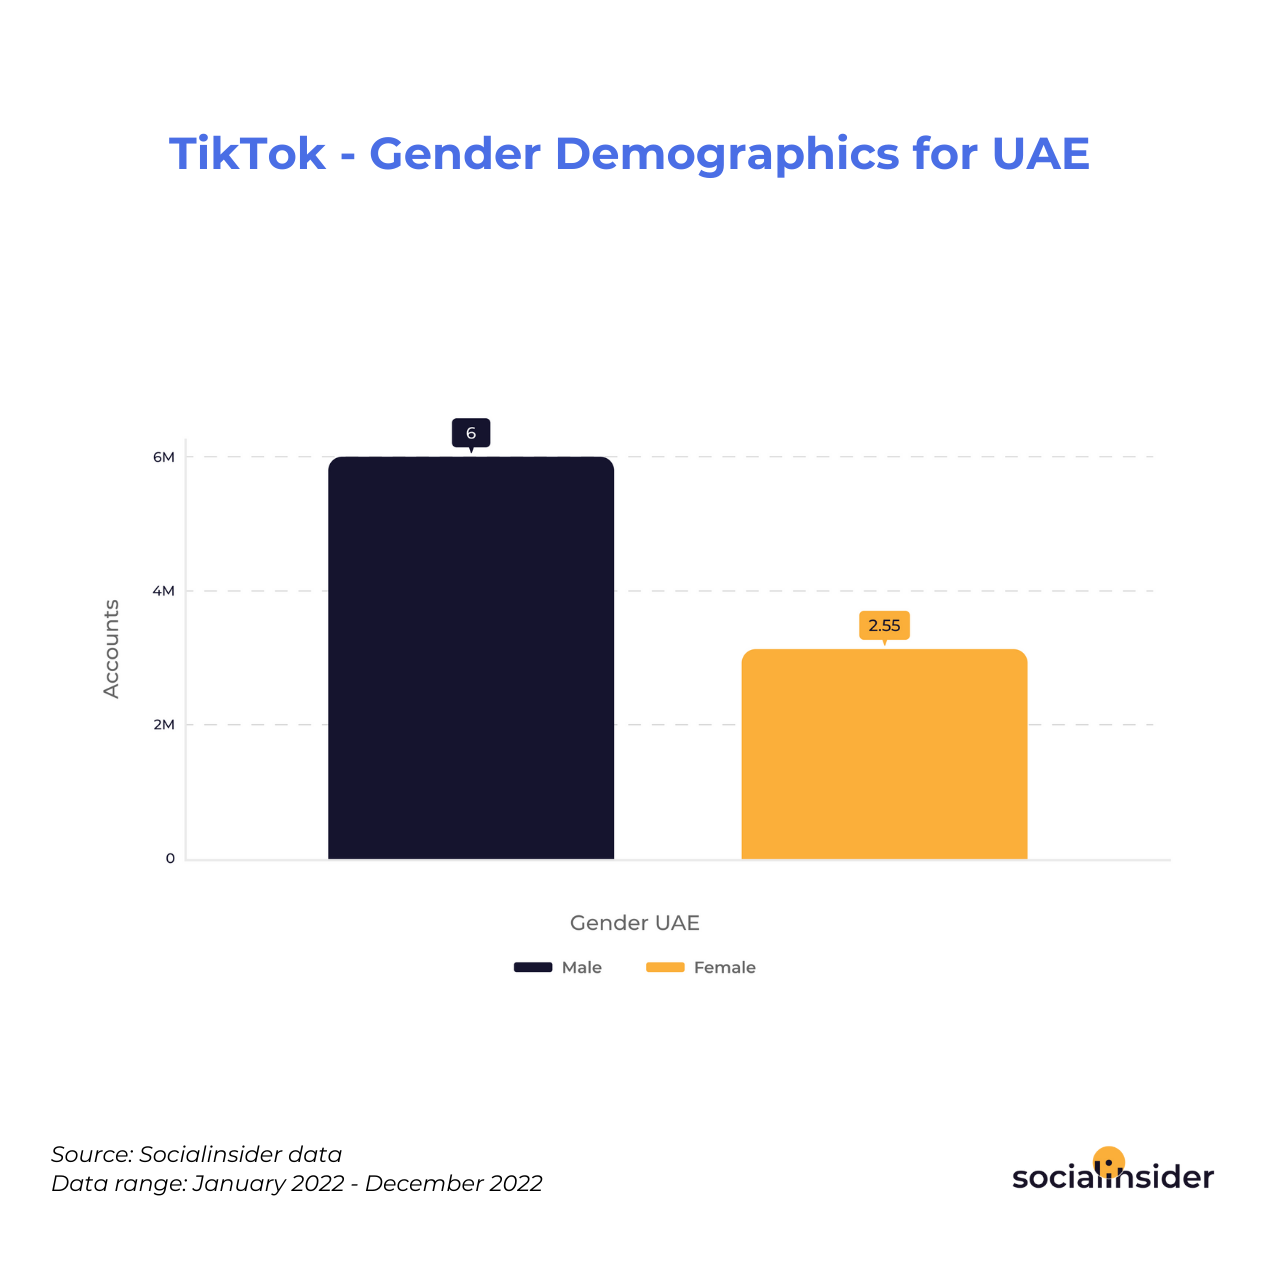
In UAE, the highest number of TikTok accounts by gender is represented by males.
Males lead with the highest number of TikTok accounts by gender, indicating a value of 6 million users. Females only have 2.55 million accounts on TikTok in UAE.
Download
TikTok - Gender Demographics for UK
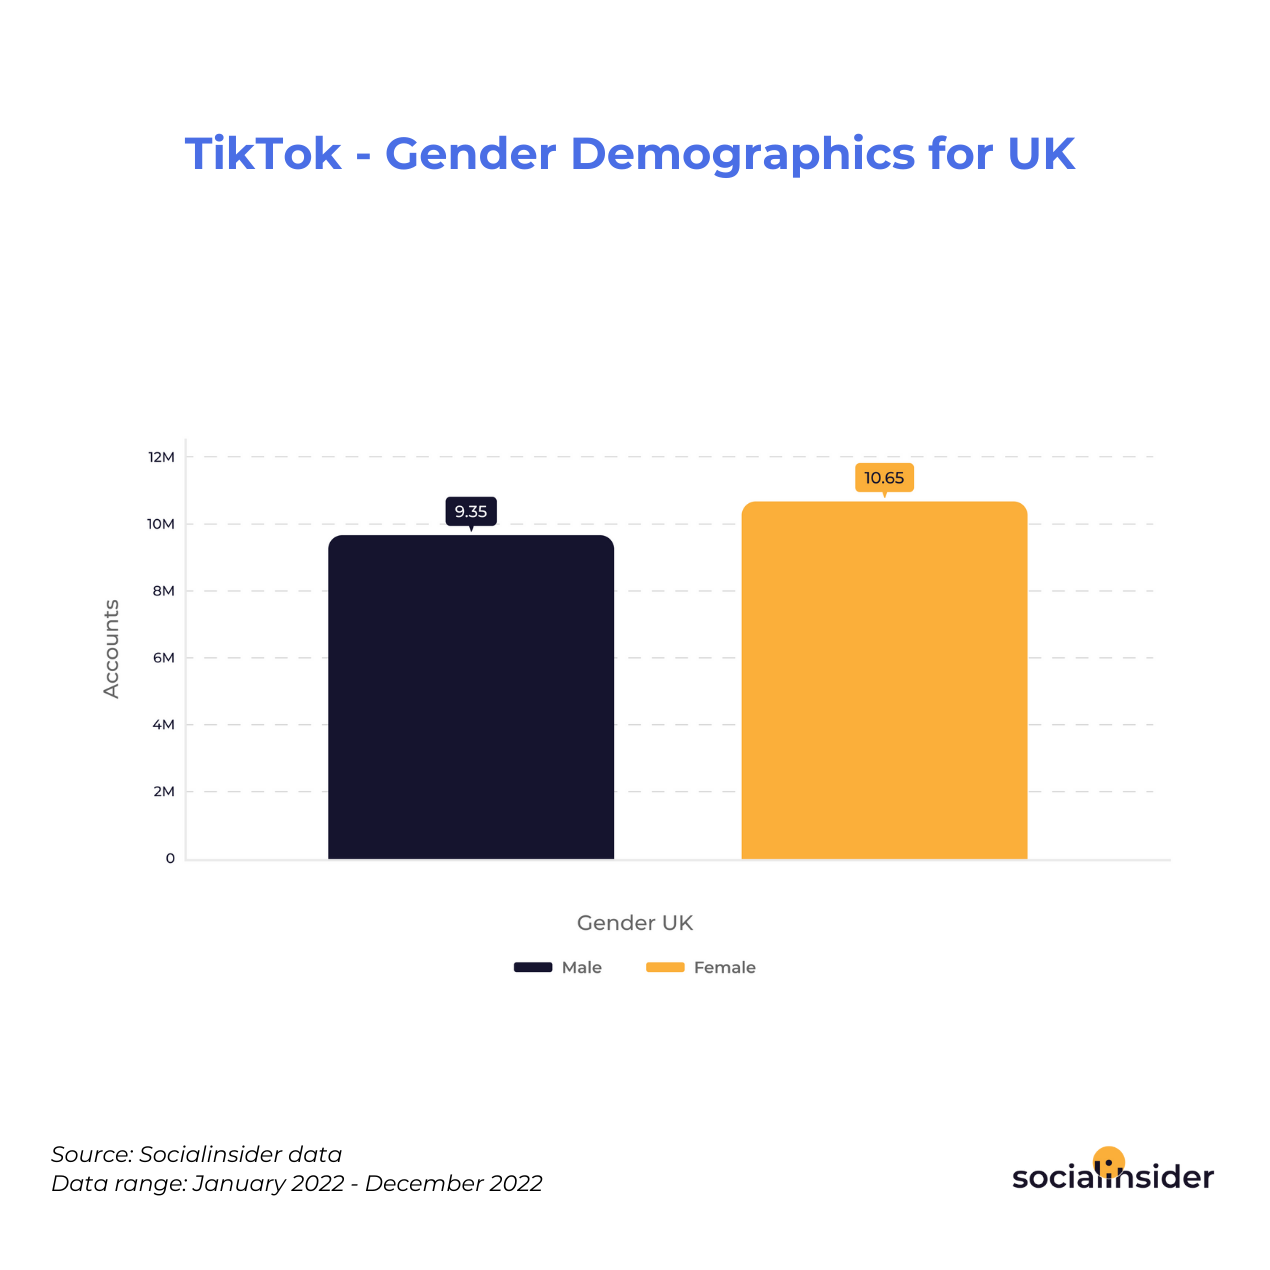
In UK, the highest number of TikTok accounts by gender is represented by females.
Females lead with the highest number of TikTok accounts by gender, indicating a value of 10.65 million users. Males only have 9.35 million accounts on TikTok in UK.
Download
Frequently Asked Questions about TikTok Statistics
1. How can TikTok statistics help digital marketers?
Digital marketers use TikTok statistics to measure their performance and to make predictions about future campaigns. These TikTok statistics packed with metrics data let digital marketers know what works and what doesn’t work for them.
2. How often do we update our TikTok statistics?
We update our TikTok statistics quarterly to bring forth data that keeps our charts relevant.
3. What do your TikTok statistics include?
Our TikTok statistics provide charts for watch rate, video views, engagement, demographics and much more data will be updated.
4. Which country is using TikTok most?
According to the latest data on TikTok's advertising reach, the United States is home to the majority of TikTok users worldwide, with 116.5 million TikTokers residing there.
5. Is posting 3 Tiktoks a day good?
How often you post can also affect how your content is distributed on the platform (TikTok recommends posting 1-4 times per day). To find a posting schedule that will please both the TikTok algorithm and your fans, keep a close eye on your performance until you find a frequency that works.
