Instagram is one of the most popular social media platforms following TikTok. And that won’t change soon.
At least, this is what some would say about this network, where everyone posts nice pictures and posh Reels about themselves that make you wonder if they’re living in real life or not.
But how real is promoting your business on Instagram? How well could that go? Well, if you’re a bit of a skeptical person, just relax.
If you closely look at numbers and keep track of analytics data, your marketing campaigns are bound to run smoothly.
Instagram metrics will offer you the actionable insights you need to develop a better social media strategy for your brand. Let’s find out together how and why to track Instagram metrics.
Important Instagram metrics to monitor
- Why you should track Instagram metrics
- Top most important Instagram metrics to look at
2.1. Engagement rate by followers
2.2. Engagement rate by reach
2.3. Reach
2.4. Impressions
2.5. Followers growth
2.6. Top-performing posts
2.7. Best time to post
2.8. Saves
2.9. Tags on branded hashtags
2.10. Traffic
2.11. Sales
2.12. Visits on profile - Instagram story metrics
3.1. Retention rate
3.2. Exit rate
3.3. Completion rate
3.4. Story link clicks - Instagram Reels metrics
4.1. Instagram Reels engagement
4.2. Instagram Reels reach
4.3. Instagram Reels views - How can Socialinsider help you track your Instagram metrics
1. Why you should track Instagram metrics
When trying to increase brand awareness on Instagram, you need to keep tabs on all clarity Instagram metrics to measure growth.
Through Instagram analytics, you can check your Instagram metrics that offer you valuable insights on how to further proceed with your social media campaign.
These metrics help you to:
-
Measure your performance
You can easily track users’ interactions with all your Instagram posts and assess how they resonate with your posts. High engagement, increased reach and a bunch of reactions are good omens. It means you should keep doing what you’re doing.
-
Get to know your audience
In case things don’t work as planned, you need to learn more about your audience. What are they searching for? What needs do they express? And, most importantly, how can you satisfy them?
By checking Instagram metrics with the help of a third-party analytics tool, you get to see data for demographics.
This is how you find out where your audience is located and at what time they are most active.
-
Consolidate your energy
When you look at Instagram metrics and check top posts to see how they’ve performed, you figure out what type of content attracts most of your audience.
This is what will determine you to consolidate your social media strategy, focusing on certain aspects you are really sure of.
You will be able to create engaging content based on what you know works best for your brand and increase brand awareness, leads and sales.
-
Identify trends
By keeping an eye on Instagram metrics, you manage to learn more about the latest trends in your industry and keep up with them.
You have to always be aware of the latest trends and portray them in your content to attract a wider audience.
-
Make data-driven decisions
The insights provided by your Instagram metrics should motivate you to adjust your social media strategy based on what data indicates.
This way, your content will rely more on effective and efficient types of posts that have already proved to bring great results.
You will notice that your brand’s performance on Instagram will increase, while also increasing ROI.
-
Develop social media reports
With well-researched Instagram metrics, you can easily develop your social media report on a selected time period.
All you have to do is to include your data in an excel to register your progress month by month or quarterly.
Based on the data in your social media report, you can further optimize your strategy to improve performance and increase metrics’ values.
2. Top most important Instagram metrics to look at
2.1. Engagement rate by followers
From those many Instagram metrics, this is one of the most powerful, that every business should monitor frequently.
While engagement represents the total number of likes and comments you’ve earned, the Instagram engagement rate shows what percentage of your followers resonate with your messages, and have taken an action to show it.
The engagement rate is a much helpful Instagram metric to analyse than purely the raw engagement number because it’s correlated with your following count, helping you to evaluate your performance more accurately, just like in the case of reach.

Permanently keeping an eye on your Instagram engagement rate per post by followers, as it indicates to you what type of content is closer to your user’s hearts, and to what they resonate to.
2.2. Engagement rate by reach
The reason why social media managers usually raport engagement by followers is that the engagement rate by reach is an Instagram metric available only for owned accounts.
Since a brand can compare its performance with its competitors only through the engagement rate by followers, it is only understanded why that Instagram metric is usually reported when it comes to engagement on Instagram.
And benchmarking with your competitors it’s actually highly recommended.
But, if you want a more in-depth look into your performance, you can always take a look at your engagement rate by reach.
Here’s how you can calculate it:

2.3. Reach
In a nutshell, we can say this Instagram metric tells you how many people have seen your content, counting only the unique views.
Furthermore, rather than counting every person that your content was delivered to, you can check your average reach rate, which will display a percentage that will be much easier to analyse in correlation with your fan count.
To calculcate your average reach rate you'll have to divide
This is a particularly important Instagram metric you’ll need to track - especially for those campaigns whose main objective is to generate brand awareness.
Also, if you’re looking for ways of getting your content viral, constantly monitoring your reach and adjusting your strategy accordingly is a must do.

2.4. Impressions
Impressions stand for that Instagram metric showing the total number of views a piece of content has had. Which means, impressions count also those repeated views of a single user.
If you're looking for ways to increase both your reach and impressions, trending hashtags can be of great help. That's because they can increase your visibility potential when people search for particular hashtags.
2.5. Follower's growth
Also known as a vanity metric, follower’s growth should not be your top-of-mind objective when creating your marketing strategy.
Of course, every businesses’ dream is that its audience shows interest in the personality and products of the brand. But you should always focus on quality over quantity.
In the end, a massive following is not so valuable if the users don’t actually engage with the brand’s posts.

Sometimes, business accounts with smaller audiences are the ones that can benefit the most out of their social media efforts.
For the times when you need to create a social media report with noteworthy Instagram metrics to showcase different results, you can check the native app for helpful insights.

Or, for a more in-depth analysis of your account, you can rely on a social media analytics tool, like Socialinsider.
Either way, data is the number one ally in evaluating your Instagram performance.
2.6. Top-performing posts
Since Instagram Reels are the new trend on Instagram right now, when doing a post's performance analysis, you may discover this is some top-notch content for your account.
By analyzing your best-performing posts, you may discover, for example, that focusing more on Reels is likely to increase your engagement. If so, continue in that direction!

An Instagram analytics tool, like Socialinsider, for example - displays plenty of insightful Instagram metrics, including your top-performing posts, based on engagement.
2.7. Best time to post
Well, in order for you to deliver your messages to your audiences, you must first find them when they’re online.

And social media analytics tools are your best friend when it comes to establishing what’s the best time to post on Instagram in order to maximize your social media efforts.

With Socialinsider you can analyze your current and optimal time schedule alongside all the other important Instagram metrics to improve your social media strategy. Isn’t it great?
2.8. Saves
Most referred by marketers as being “the new like”, this is the hottest, newest Instagram metric that brands are impacted by.
Through the pressing of the save button, people show you they really appreciate what you have to say, that they find your information useful, which is a win-win situation.
By including saves into the list of Instagram metrics that you need to track you’ll get a hint on the type of content that your audience resonates to, and adjust your content planning accordingly.
When calculating engagement, besides liked and comments, some platforms also include saves. However, this is an Instagram metric included only for owned accounts.
2.9. Tags on branded hashtags
Since hashtags are one of the topics that interest people the most when talking about Instagram, I thought they deserve a special spot in this list of top Instagram metrics.
Because, it is, after all, a way of measuring your business’ success, right?
That hashtag discussion can be taken into a lot of directions, but for now I’ll just cover the topic of branded hashtags.
Using a branded hashtag is a good strategy for raising awareness for your brand, especially when conducting a user generated content campaign.
The great benefit of having branded hashtags is that you can see what people are saying about your business.
Every time someone posts something on Instagram and includes your hashtags, you’ll be able to see those posts and the results they generate.
A very important thing to know is that you can get Instagram insights about hashtag’s performance only through an Instagram analytics tool.

For example, with Socialinsider, you can get an overview of the total posts that use the hashtags, the engagement and impressions received, posts evolution, and other top hashtags used together with your hashtag and their average engagement.
After discovering all this information, isn’t it that you’ll be paying more attention to hashtags analytics?
2.10. Traffic
Well, communication campaigns may have a lot of goals, but ultimately every brand’s main objective is to get conversions.
And since you want to know which ways can help get more leads, which channels are the most powerful to use so that you increase your revenue and what it’s worth investing into, you have to always monitor your traffic.
For Instagram there are not so many options of including your website’s links, except for the link in bio and those in stories.
By injecting some code pieces, which are called UTM parameters, you can link your Google Analytics account to your Instagram and observe how many people land on your page from it.
2.11. Sales
When Instagram introduced the shop feature, it made a gigantic step in both e-commerce’s world, as we all in social media’s, revolutionising the regular selling process.
With the many action options available on the platform, it’s no wonder how it makes its way to the top into remaining one of the most beloved social media network.
Now, just because someone has arrived on your landing page, it doesn’t necessarily mean they will automatically buy something.
And by including sales in your Instagram metrics list, when doing your social media reporting and analysis, you can actually understand what type of content is more likely to convert.
That’s why, besides traffic, sales are another helpful and great Instagram metric to track.
You want to make sure that going down the funnel, your target consumers do more than just snoop around a couple of pages and actually buy something, since this is the engine that keeps any business floating.
2.12. Visits on profile
Profile visits, another key Instagram metric, account for the number of views on your profile.
When a user reaches your profile for the first time after searching a certain hashtag, chances are this user can become your follower if they think the content and aesthetics are appealing enough.
Quality content that aligns with your brand's story can enhance brand recognition.
The number of visits on your profile will increase if they sense consistency and posts that reflect a well-built strategy.
3. Instagram story metrics
Initially released on Snapchat, Instagram has seen the user’s growing attractiveness to stories and soon introduced this feature on the platform as well.
After this incorporation, Instagram stories started to steal the spotlight, and became one of the user’s preferred ways of interacting with brands.
Given the audience’s interest and investment in a brand’s Instagram stories, it becomes undeniable that a couple of insights about this Instagram feature should be analysed before conducting any social media campaign.

Here’s what you should consider when analyzing the performance of your Instagram stories:
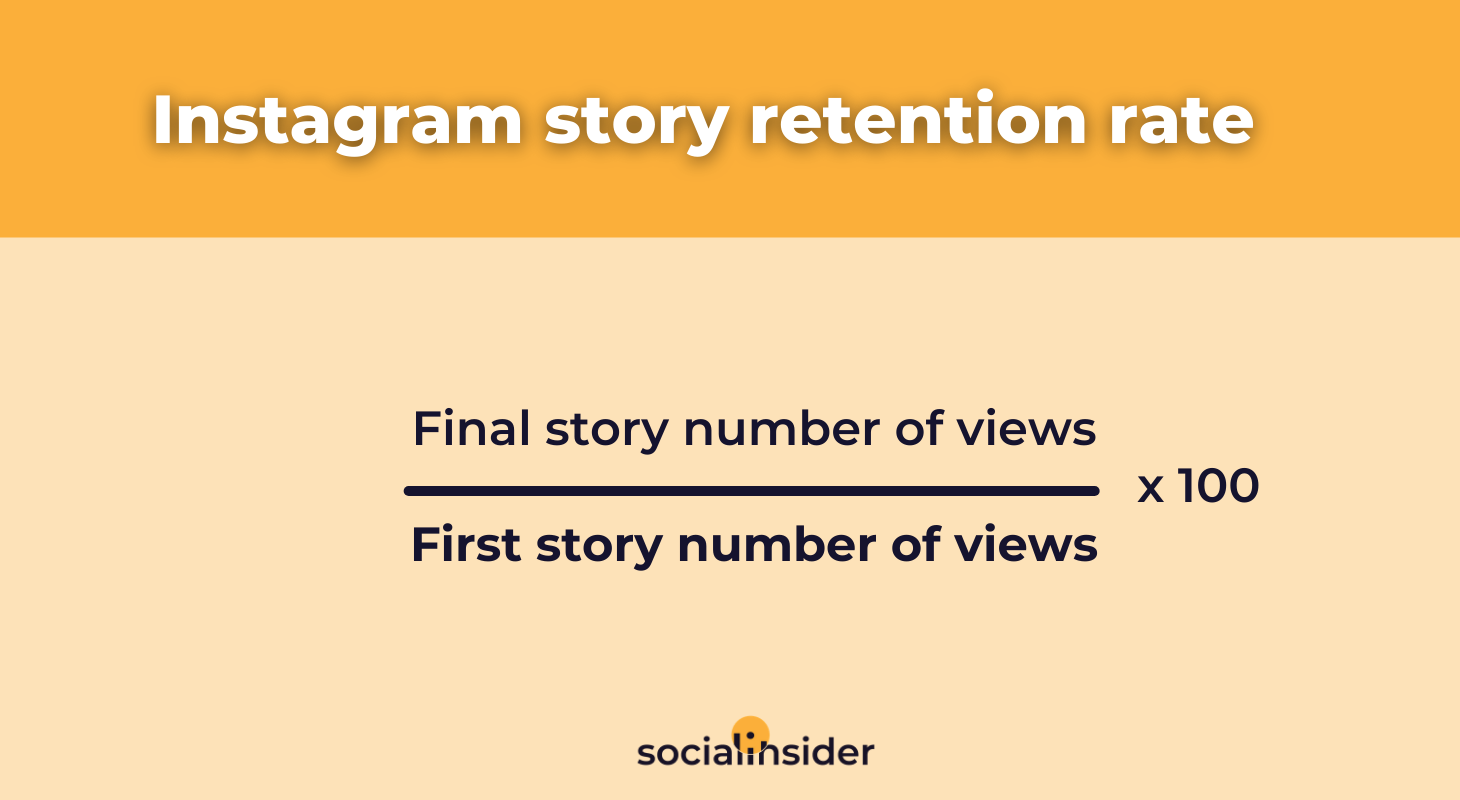
3.1. Retention rate
Keeping your followers engaged enough to view all the stories you’ve posted is not an easy job. It requires excellent content, tailored to your audience’s preferences.
But the good news is that you can actually draw powerful insights about what type of content stirs your audience’s interest by looking at your click through rate.
The click through rate is an Instagram metric that displays, under percentage form, how many people have watched your stories from the beginning to the very end.
3.2. Exit rate
In case a big amount of people abandon watching after the first story, this is a huge warning sign that something fails at delivering people what they expect from your brand.
And here’s where the story's drop off rate steps in. Thanks to this Instagram metric you can calculate how many people are quitting after seeing your first Instagram story (in case there’s more than one, of course).
If you’re lucky and that percentage indicates a low number, congrats! It means you’re doing something good.
But, in the opposite situation, you should start taking another angle on your Instagram stories, because the current approach is clearly not working.

The good thing is that you can always count on data to help you improve your social media presence.
If you understand how to properly analyse it and adapt your efforts based on that, the results surely won’t take long to appear.
3.3. Completion rate
This Instagram metric is important to analyse in order to discover how many people from your audience are your loyal fans, show interest and listen to everything you have to say.
The story completion rate is an Instagram metric that measures what percentage of viewers watch the entire length of your story slide, without clicking away, in fast-forward mode till the end.
It is calculated by taking out the number of exits from the number of impressions and then divided by the impressions number.
3.4. Story link clicks
Instagram Stories are -usually -the first type of content with which your audience interacts.
This is why you need to focus on creating stories that convince users to click on your profile and find out more about your product or services.
Including clickable links in your Instagram Stories can increase your traffic -which is awesome.
By clicking the links in your Instagram Stories, users will reach your website, where they can find out more about your products.
When users get to your website, the chances of them completing a purchase are even more significant.
4. Instagram Reels metrics
Every marketer should use content that suits their brand and appeals more to their viewers.
Depending on the number of followers, carousels and reels work best for certain profiles.
Reels attract more viewers, increasing the number of visits to the profile, even if they do not necessarily interact with their posts.
Therefore, the content of your Reel must be unique, sprinkled with helpful information and many relatable situations to make the audience feel connected to your brand.
4.1. Instagram Reels engagement
The Reels engagement metric accounts for your video's total number of likes, comments, shares and saves.
You should take advantage of the popularity of this new Instagram feature to explore new content strategies.
To ace Reels engagement, you have to take advantage of the new trends.
Posting Reels on topics people are already interested in, will help you increase your engagement rate.
You should also be ready to experiment with new ideas, depending on your audience’s interests.
To establish your engagement rate on Instagram Reels, you need to divide the number of Reels interactions by the number of Reels Plays and multiply by 100.
If you pay attention to what’s popular on TikTok, you will manage to have viral Reels by integrating what’s trending.

When analyzing Reels analytics, you should look at the most critical metrics, like engagement, views, and reach.
To keep track of Instagram Reels engagement, you can verify likes, comments, shares, saves, interactions, and plays via Instagram analytics tools, such as Socialinsider.
4.2.Instagram Reels reach
Instagram Reels can be considered a fun type of content because they are reliable in building brand awareness.
Since Instagram Reels is a new feature, they have a greater chance to become viral because users tend to choose more visual content than posts filled with texts.
Usually, Reels have a higher reach compared to carousels and photo posts.
Moreover, Instagram Reels improve the aesthetic of your profile, making everything look professional and creative at the same time.
4.3 Instagram Reels views
The total number of views on your Reels shows how many Instagram users have looked at the video, irrespective of whether they are your followers or have simply seen your post in their newsfeed.
Your Reel’s watch time is an important metric that shows for how long users look at your content. Since no one has much time to watch long Reels, you need to make sure you build suspense to determine users to stay on your Reel until the end.
To viral your Instagram Reels, there are a few tricks you could use to increase the number of views. Using targeted hashtags can really change the game for your brand.
Your Reels will get noticed by a larger audience based on hashtag searches. Hashtags help you aim a certain group of users who will be interested in your content.
When posting your Reel, you have to be aware of the best posting time to make sure your post reaches users’ news feeds just in time.
All these Instagram Reels metrics are available on the Insights "Overview" screen. There you will find everything you need to know in one place.
5. How can Socialinsider help you track your Instagram metrics
When you have your list of clarity metrics to check on Instagram and you know exactly how to calculate them, it’s time to see how a third-party tool can help you make the most of them.
By using Socialinsider, you can check a bunch of metrics for different content types. First, make sure you add your Instagram profile in your Project.
You can either type in the name of the brand or insert the URL and add the profile.

Then click “Go to profile” and you will see all the data you can get.

In the Overview section, right at the beginning, you can see a series of Key Metrics. At the top right corner of the page you can select the timeframe you’re interested in to see results for that specific period.
This part of the Dashboard shows you the values for organic engagement, follower growth, follower count, number of posts and a few more metrics.
You can see all these metrics detailed below, while scrolling through the dashboard.

First, you will see Instagram metrics for posts, ranging from posts evolution, posting times, average posts per day, boosted posts, organic posts, day with most posts and hour with most posts.

Next, there are metrics that define the level of interaction the users had with your content, namely likes, comments, shares and then you can see the total number of interactions.


Moreover, you can also see a bunch of metrics about hashtags. You can see top hashtags, top hashtags by average engagement, top hashtags by average impressions.

In the Dashboard, you also see metrics for Reels, like total impressions.

Moving forward, you can check your top 3 posts and see individual metrics for each of them.

Then you can also check the metrics for your top 3 stories and also other key metrics for stories.

Some of the key metrics for Instagram stories include stories impressions, reach and posts by type.

The next section in the Dashboard is about your followers. Here you can see metrics like followers growth month by month.
Then the most important metric appears and takes up a lot of space, packed with data about the best time to post by engagement, day with the highest engagement and hour with the highest engagement.

Next, you can see engagement evolution and even the split between paid and organic posts’ engagement.

Then you can check post types by engagement and average engagement.

Besides the fact that you can check the best time to post by impressions, you can also check a rare metric like profile email link clicks.
Even if you may have that option there on your brand’s Instagram page, to allow people to send you emails, you probably wouldn’t think you can measure the number of clicks on that link.

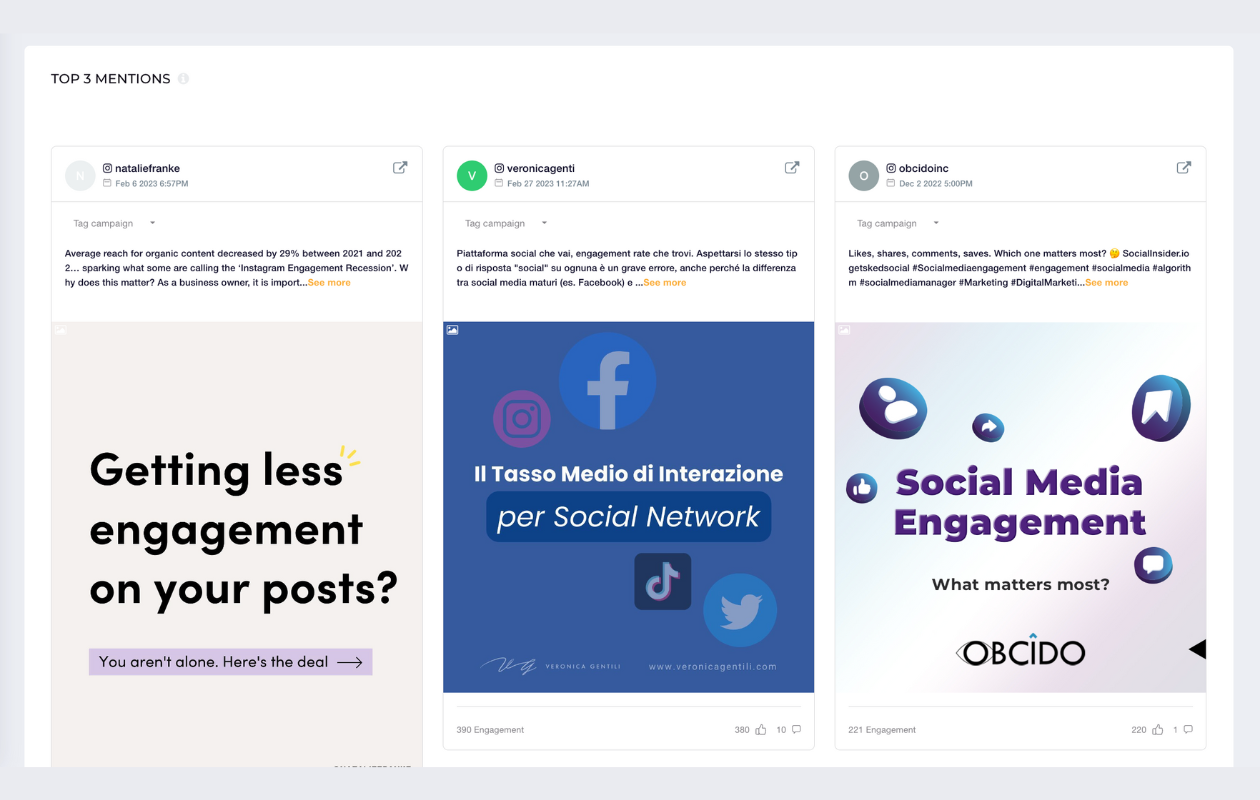
The next section in your list of Instagram metrics you can check with Socialinsider is Mentions.
Here you can see mentions’ evolution, their count and top 3 mentions with the most important metrics for each of them.

Demographics is the section where you can see everything you need to know about your followers.
You can see info like country, city and how many followers you have from each of those locations.

When scrolling further, you can see the split with followers by gender and age and then you’ll also see when your followers are available.

If you go back up, to the top of the page, you can switch to the next page called Posts. On this page you can see all your Instagram posts for the selected time period.
You will also see individual metrics for every post that was published in the timeframe you’ve selected.

Next, the third page in the dashboard is Stories. Here you can see a lot of key metrics for Instagram stories.

The Instagram metrics available for stories in Socialinsider range from impressions, replies, average peak reach and a lot more.

By further scrolling through the dashboard you can see the post time for your stories, the retention rate and peak reach by day.

You will also get some actionable insights like best time to post by reach where you will see what’s the best interval for your brand to post stories.

You can also see stats by story type, namely image and video and at the end you can see all your stories posted in the designated time frame with key metrics for every story.

Recently we added a new feature that could help you enrich your social media reporting. There is a paid section where you can check all your boosted posts and ads.

Using this data, you can track the ROI of your paid marketing efforts by looking at the following KPIs: ad spent, impressions, reach, CTR, CPM, CPP and engagement.
You can get split data (reach, impressions, engagement) for organic and paid performance inside Profile Overview.
All you need to do to get access to your paid data insights is to connect a Facebook or Instagram account that you own or manage and connect the Ad account used to create the ads.
After checking the paid section, the next page is Compare. You can add one of your competitors and compare side by side your key metrics.

If you go to Campaigns, you will see all the running campaigns you have for your brand and check their individual performance.

Final thoughts
The use of Instagram metrics when crafting or adjusting your marketing strategy is a blessing since you can roll out a better strategy.
By checking analytics, you will learn what changes are needed in order to increase brand awareness and attract a wider audience.
Hopefully this list of crucial Instagram metrics helps you understand what to look at when developing your social media report and what your focus should be.