In this fast-evolving digital era, LinkedIn analytics is crucial to track your performance and always know where you’re situated compared to other brands from your industry.
With LinkedIn analytics you get to be in control of your progress, content strategy and campaigns’ performance, adjusting everything as you go.
Your success will be strongly influenced by keeping an eye on key metrics on LinkedIn, learning about your audience needs and preferences and reporting.
In what follows, we’ll learn everything there is to know about LinkedIn analytics and why it’s important.
Let’s dive in!
How to check your LinkedIn analytics - a step by step guide
1. How to use your LinkedIn analytics data
Using LinkedIn analytics means looking at data, at LinkedIn metrics that offer you insights about your brand’s page performance.
By periodically checking your LinkedIn analytics, you make sure that the content you publish is in line with your brand’s values and principles and it also satisfies your audience’s needs.
This is how you’ll be able to transform your audience into a community.
LinkedIn analytics is split into two categories: native LinkedIn analytics KPIs and third-party LinkedIn analytics data.
Within the native app, you get only a few key metrics for your LinkedIn content’s performance.
However, when it comes to LinkedIn analytics tools, you get a wide plethora of data that can help you develop extensive reports, based on demographics, main metrics and type of content.
Depending on your social media strategy, you will know exactly what your focus is and how much data you need to keep an eye on in order to attain your goal.
You can even split LinkedIn analytics into free and paid LinkedIn analytics tools, where the free version is only in the native tool.
2. The difference between native LinkedIn analytics vs third-party LinkedIn analytics tools
How to access LinkedIn analytics within the native app
- What metrics you can look at
First, you need to go to your LinkedIn page and click "Analytics" from the upper menu. There you can choose from the drop-down menu to look at analytics for Visitors, Followers, Leads, Content, Competitors and Employee Advocacy.
When you want to access LinkedIn analytics within the native platform, you have to go to the section called Content in order to check how your posts have performed. This will help you prepare or adjust your existing LinkedIn content strategy.
The advantages and disadvantages for using native LinkedIn analytics
- Accessing free LinkedIn analytics
By looking at the data you get here for free, it can help you decide whether you need to see more insights, depending on the goal you’ve set for your future campaign, or you simply stick to the key metrics you get here.

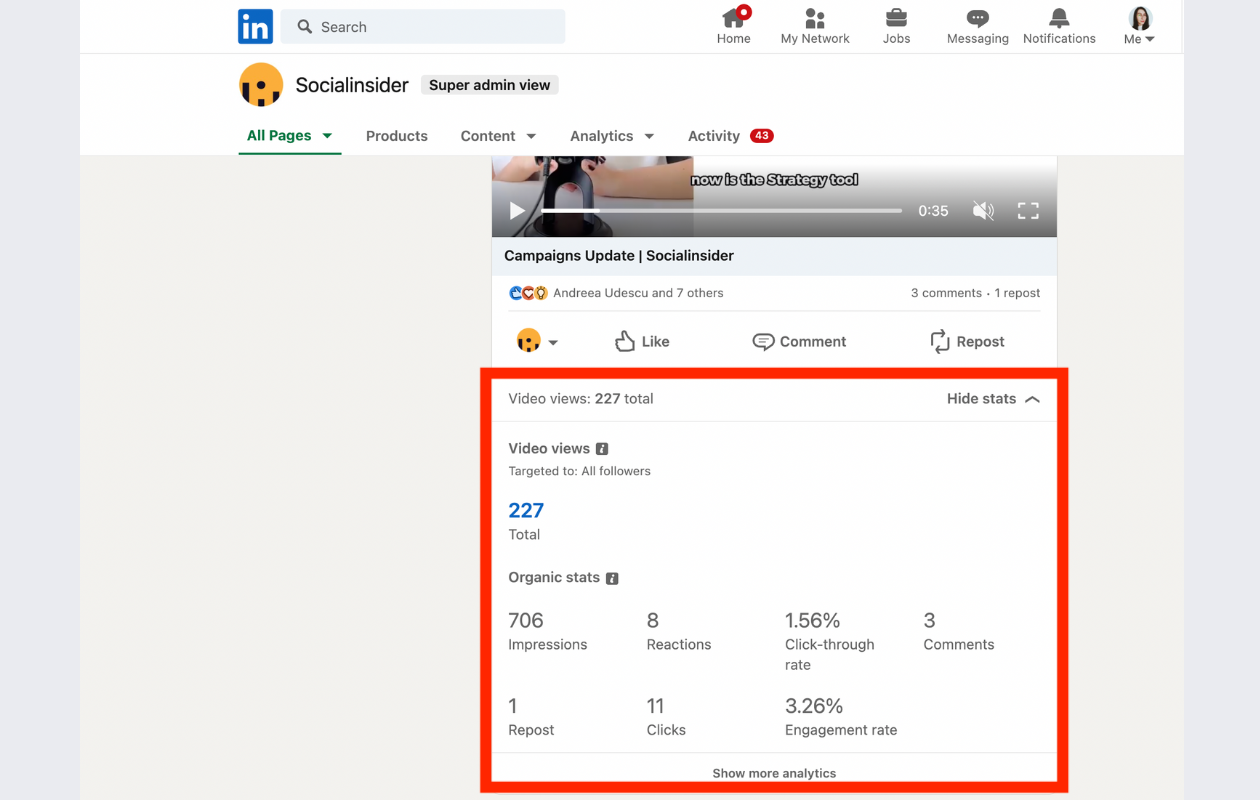
- Getting video performance metrics
When you go to posts analytics on a video you've published, you can check a very useful metric, apart from the main ones, like impressions, reactions, CTR and engagement.

If you click "Show more analytics" you will get a very insightful chart about video performance.

Here you can see exactly how many unique viewers are, the total number of views and how many minutes your video was watched.
- Customizing timeframe
However, different from a third-party LinkedIn analytics tool, the native app doesn’t allow you to choose a timeframe older than the last 365 days.
The “Custom” button will not take you further back, if that’s what you’ve thought.

- Sorting LinkedIn posts
Another disadvantage is that you cannot sort your LinkedIn posts from the specific timeframe in any way.

You will just see them as a table, being able to check individual key metrics like impressions, views, clicks, CTR, reactions, comments, reposts, follows and engagement rate.
- Downloading reports' format
When it comes to reporting, the only type of document you can get when hitting Export is an .XLS.

How to access LinkedIn analytics with Socialinsider
Now, when using a third-party LinkedIn analytics tool, you get a lot more data and you can unlock many more LinkedIn features, compared to the native app.
Firstly, the key metrics you see in Overview show you the progress you’ve made during the timeframe you’ve selected.
When it comes to choosing your timeframe, you can go as further back as you want, even a few years ago by going to "Custom". This way, you’ll see how your first LinkedIn posts looked like back then.

By scrolling down in Overview, you get to see a lot more metrics than you get in the native LinkedIn analytics app.
Next, if you click the Posts section, right next to Overview, you get to see individual metrics for all the posts published in that specific timeframe.
The cool part with Socialinsider is that you can sort them by post type and keyword to see exactly how the posts in a certain campaign performed.
This way, you can also compare the performance of your posts depending on their type, knowing exactly which one is more engaging, focusing to deliver more of that.
Here I searched using the keyword “social media” and I selected articles as a type of post. It turns our there are 62 out of 605 LinkedIn posts, published in that timeframe, that feature that keyword.

Next, I searched using the keyword “updates” and I selected document as a type of LinkedIn content. The results show that there are 20 posts out of 605 that use this keyword in that specific timeframe.
These in-depth insights help you develop a more engaging campaign for the future. The Posts feature provides a lot of actionable insights that you cand track and include in your LinkedIn content strategy.
3. Key metrics to monitor when checking your LinkedIn analytics
Marketers know that all LinkedIn metrics are important when designing your content strategy.
To be honest, there are some which are crucial and without them you’d feel like travelling blindfolded through the digital world.
Here is our list of key metrics to track with LinkedIn analytics, especially when using a third-party LinkedIn analytics tool:
-
Impressions
This LinkedIn metric is essential to monitor LinkedIn KPI that displays the total number of times LinkedIn users viewed your posts in their timeline.
Your posts can appear in all signed-in LinkedIn members’ newsfeeds, even if they follow your profile or not.
The number of impressions your posts gather are strongly linked to how users engage with your content.
When the impressions’ rate is higher, the chances for users to click on your content increases.
-
Engagement Rate
Since most new marketers are wondering how to calculate engagement rate, here is a useful definition.
Your LinkedIn engagement rate is given by the sum of likes, comments and shares, divided by the number of posts in a given timeframe, then all divided by the number of LinkedIn impressions you got.
The result you get is then multiplied by 100 to obtain a percentage.
Building a strong LinkedIn profile with useful data, playful posts, and a friendly approach will help users find the familiarity that lies within.
By constantly keeping an eye on your LinkedIn analytics, you will manage to supervise the changes that take place on your platform audience-wise.

-
Click-through rate
This valuable LinkedIn metric shows you the percentage of viewers who have clicked through your content, keen on learning more about your brand, products, or services.
To establish your LinkedIn profile click-through rate, you need to divide the total number of clicks your posts get by the total number of impressions.
If your CTR has a high value, it means LinkedIn users have attentively studied your content and did not rush through the information displayed.
To increase your click-through rate, you need to use powerful images and creative captions for your posts.
Your content needs to be clickable, likable, and shareable to convince your audience that you offer them quality insights.

-
Reactions, comments, shares
When you create a LinkedIn post, users can select different emojis to show that they like, celebrate, support, love, feel the post is insightful or feel curious about the content you share. We call this a reaction.
Shares is the number of times a LinkedIn user decides to share your content with their own LinkedIn following, meaning your post was interesting, insightful and more people should see it.
Comments are the number of user comments left below your post. Important to mention here is that when someone leaves a comment on one of your posts, make sure you take time and respond to those comments.
-
Follower growth
If the numbers go down for your Followers growth metrics, it may be because your content wasn’t targeting your audience, so it is time to change something in your LinkedIn content strategy.
If your posts make people react and share your content, you may finally attract even more followers.
-
Video views
LinkedIn videos can be categorized into native videos and external videos. Native videos are the clips you share via LinkedIn posts.
External videos feature links to third-party video websites, like YouTube.
To count as a view, a user must see at least the first 3 seconds of your video material.
The video views metric shows the total number of times your video content has been seen by users, even if they’ve seen it multiple times or not.
This LinkedIn audience insight can also account for emotional connection and memorability for your visitors.
Video views reveal the attention span of your audience and they represent a metric that weighs more than any other post views.

-
Posts analytics
Posts analytics are insights that you can see individually, for every post you published.
With post analytics, you get the key metrics, like impressions, reactions, clicks and engagement, but also some specific video metrics that are very valuable for your LinkedIn performance reports.
-
Reposts
Reposts are part of posts analytics you get in the native LinkedIn analytics tool. This metrics shows how many times your LinkedIn post was shared.
The higher the number of reposts, the higher the number of impressions. Also your brand awarness will boost as more and more users will see your reposted post in their newsfeed.

-
Demographics
In Socialinsider, you can see a lot of insights for Demographics.

Besides seeing the geographical distribution of followers, you get a lot more in-depth data about them.

You can check follower seniority, function, industry and company size. All these insights can help you develop content accustomed to your audience, crafting posts that can attract them to engage.
-
Organic vs paid performance
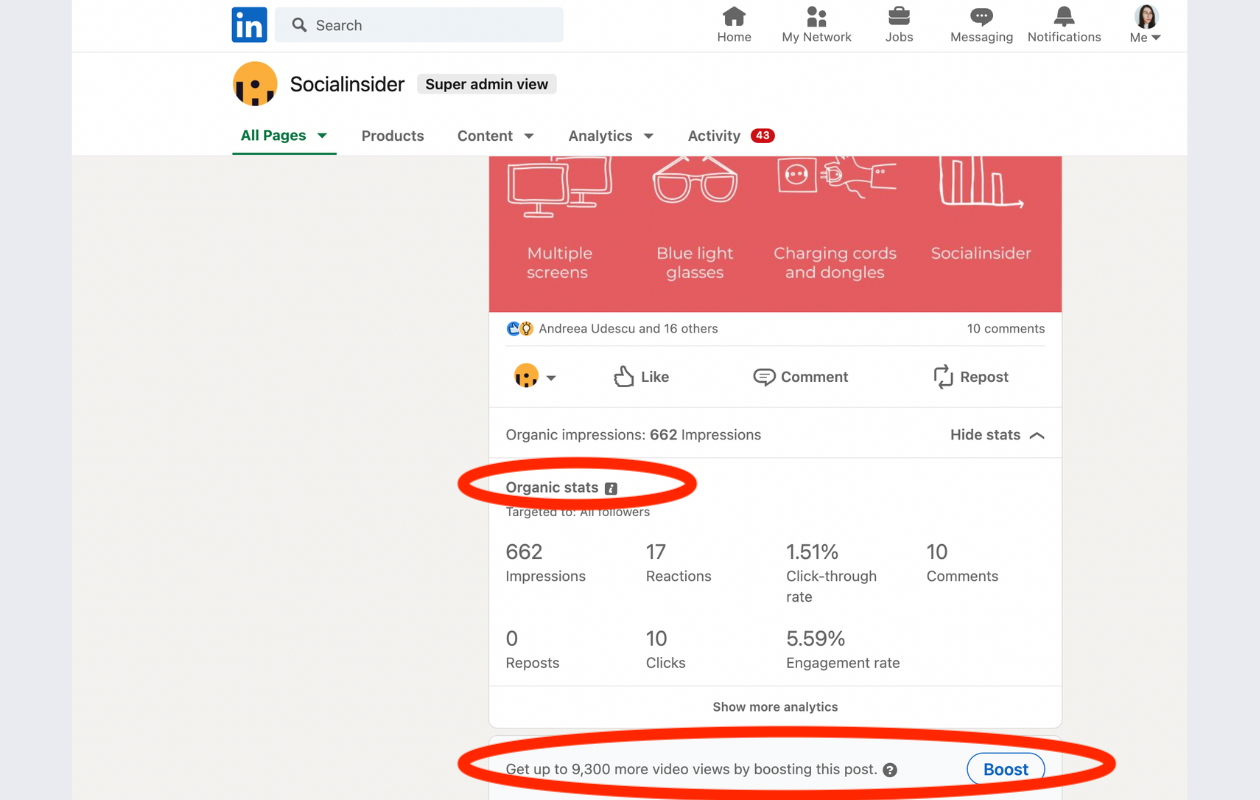
In the native LinkedIn analytics app you get to look at organic stats in posts analytics.
To see analytics for your paid posts, you have to have an ongoing ad campaign on LinkedIn.
Through a bunch of CTAs, the native app will suggest you to boost your posts. If you decide to do so, your organic posts will have a greater chance of virality, and all the metrics for that post will skyrocket.
-
Employee advocacy program
The native LinkedIn analytics app also features a section called Employee Advocacy analytics.
Employee advocacy means that the employees of a company promote their company in theis posts. This can contribute to the increase of brand awareness, talent acquisition and more sales.

In one of our podcasts, our guest Emma Heath talked about the use of employee advocacy programs and how to track data from employees.
She says that she uses this analytics feature to encourage employees to share their own voice on social media. By using employee advocacy, she managed to increase th number of leads as employees have posted more about their company.
A useful tool that can help you with the employee advocacy program is Shield. With this app you can easily track the performance of your employees' LinkedIn posts.
4. Top LinkedIn analytics tools
When it comes to figuring out the best LinkedIn analytics tools, you have to know that there are a lot. Here is our list of top LinkedIn analytics tool that provide a bunch of useful features:
1.Socialinsider
2.SproutSocial
3.Hootsuite
4.Social Pilot
5.Klipfolio
6.Whatagraph
7.LinkedIn native analytics
8.Iconosquare
9.DrumUp
10.Talkwalker
11.Inlytics
12.Shield
13.ReportGarden
14.Unmetric
15.Brand24
16.Social Status
17.Rank Ranger
18.RivalIQ
19.Buffer
20.Vaizle
Final thoughts
All this data about LinkedIn analytics helps you adjust your LinkedIn marketing strategy based on your performance so far.
The actionable insights you get through LinkedIn analytics are the perfect pillars you should lie your content on to make sure your brand conveys just the right message.
You should definitely use a third-party LinkedIn analytics tool that provides you with the right amount of data about top KPIs. Then you can easily include them in your reports and craft better LinkedIn campaigns as you g(r)o(w).