


Nowadays people are more likely to pay attention to details and appreciate all the innovative and authentic ways in which marketers (and the brands they represent) choose to advertise their product on Instagram.
Since the average time spent on Instagram on a daily basis is around 30 minutes, marketers need to learn how to best use that time in their favor.
To make sure they made the right call, marketers need social media data to analyze their impact on prospective clients.
To start learning how to check Instagram analytics, you first need to upgrade to a business account.
Here are some top insightful tips about how to look at your Instagram analytics data to optimize your strategy!
How to look at your Instagram analytics
- Why should you learn how to check Instagram analytics?
- How to check Instagram analytics in the native app
1. Why should you learn how to check Instagram analytics?
To be successful at social media marketing, marketers need to uncover primary Instagram audience insights. This is how they can understand more about who is their audience, what social media content they prefer and when they are active.
Instagram analytics provides the proper data that can help you improve your business and pave your way to success.
These insights can help you boost your brand’s performance by teaching you how to improve your social media strategy.
Due to Instagram audience insights, you can learn what results different social media posts bring. By finding the proper Instagram metrics to track, you can grow your community.
Instagram statistics and insights offer you the chance to make your brand shine and stand out from the online crowd.
2. How to check Instagram analytics in the native app?
To easily access Instagram analytics, you first need to switch to an Instagram Business account. This is how you’ll have access to ads, and your visitors will find it easier to contact you.
After you've successfully converted your profile, you are all set to explore Instagram analytics. All those Instagram statistics and insights will help you improve brand awareness and performance.
Once you’ve switched to an Instagram Business account, a new button will appear on your profile that looks like a bar chart, situated above the number of followers.
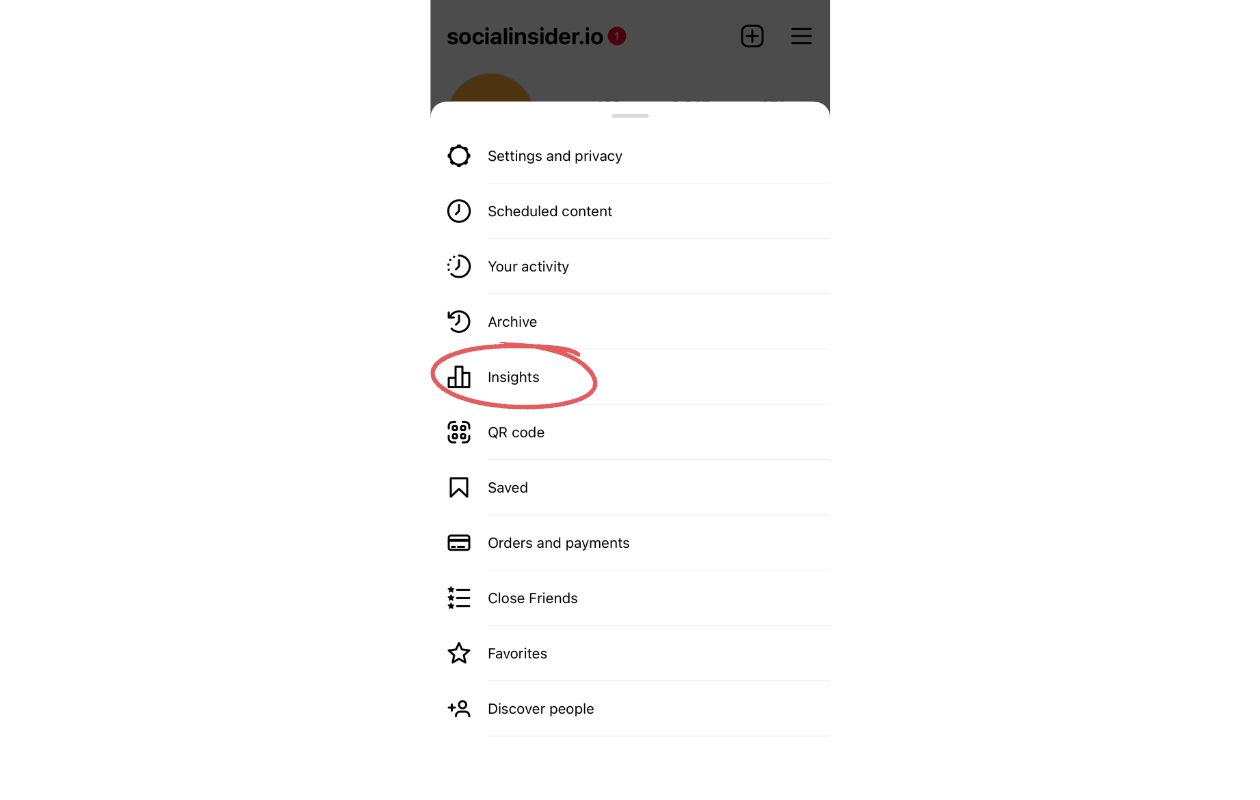
Tapping this button will take you to a new page where you can view all your Instagram profile analytics.
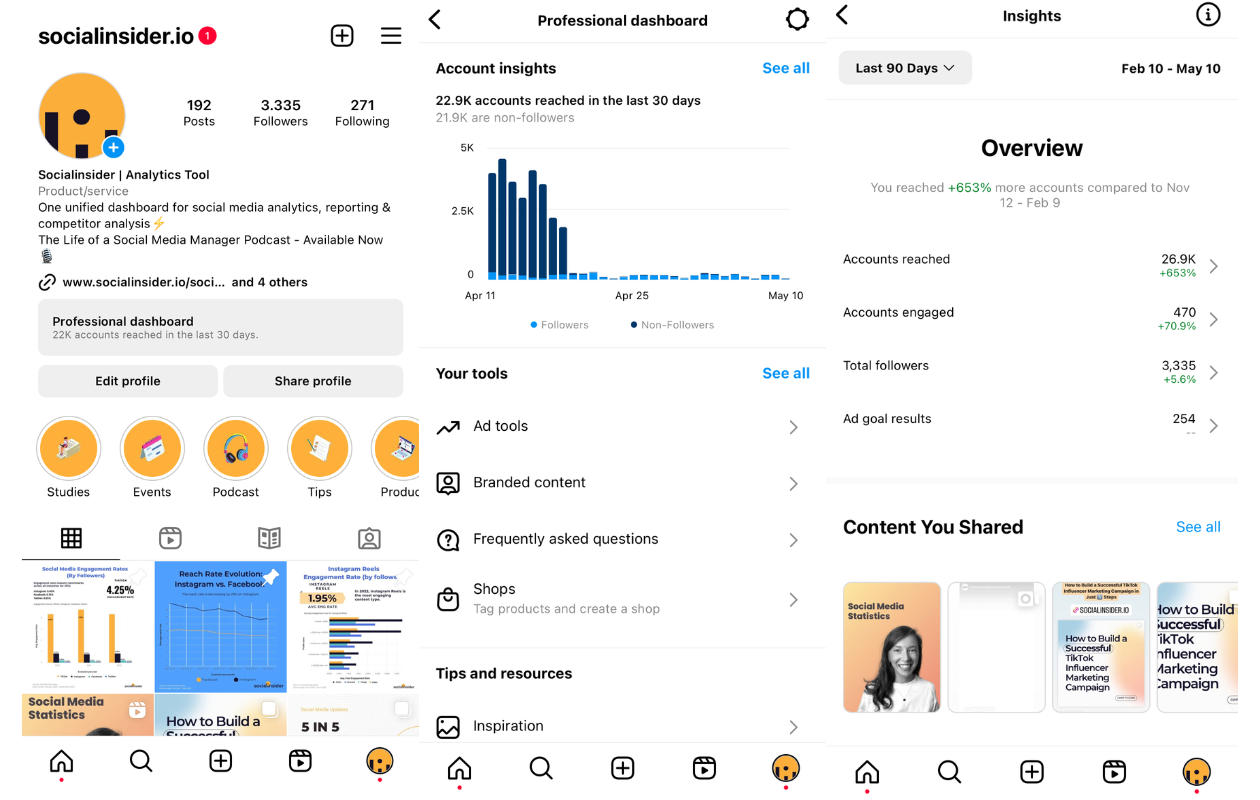
Be aware of the fact that Instagram offers you the opportunity to check analytics for only up to 90 days.
If you need historical data from previous posts or more in-depth information, a tool like Socialinsider can be of greater help.
Socialinsider offers you comprehensive and well-documented Instagram analytics, with complete reports and statistics. What's even cooler, Socialinsider will grant you access to exclusive competitive insights.
Let's explore a comprehensive list of all the Instagram KPIs you should care about and measure using Instagram analytics tools:
Instagram profile analytics
-
Growth
This Instagram metric shows you the decrease or increase of any other metric. For instance, follower growth displays the count of your followers and how it changes over time.
There are other Instagram insights that track your growth, such as reach, impressions and engagement.
-
Rate
Rate metrics offers you a percentage figure to help you make better use of certain metrics.
A useful example is the interaction rate. This represents the percentage of your audience who have interacted with your posts, Reels and Stories.
For Stories, shares, replies and likes are considered to be interactions with your followers. For Instagram posts and Reels, comments, likes, shares and saves are grouped as interactions by Instagram analytics.
-
Average
Average metrics offer you insights about your general performance of your Instagram posts.
For instance, when it comes to average likes per post, you can find out the total number of likes your posts got. You can also select a time period for a more accurate result.
-
Reach
The reach of a post measures the number of unique users who have seen your content on Instagram, including photos, videos, Reels, Stories and carousels.
In order to check this feature through Instagram analytics, you need to access the overview section to get the number of accounts your content reached in the last 7, 14, 30 or 90 days.
The number of accounts reached by your posts is the reach of your profile.
-
Impressions
Instagram impressions represent the total number of times your content has been displayed, even if some users have seen your posts multiple times.
-
Profile visits
Sometimes when a user randomly sees one of your posts in their newsfeed, they’ll often turn to your profile, if the content they see is engaging enough.
By reaching your Instagram profile, it means they want to learn more about your brand.
Profile visits reflect how efficient your content is and how it can drive users’ interest towards your brand.
-
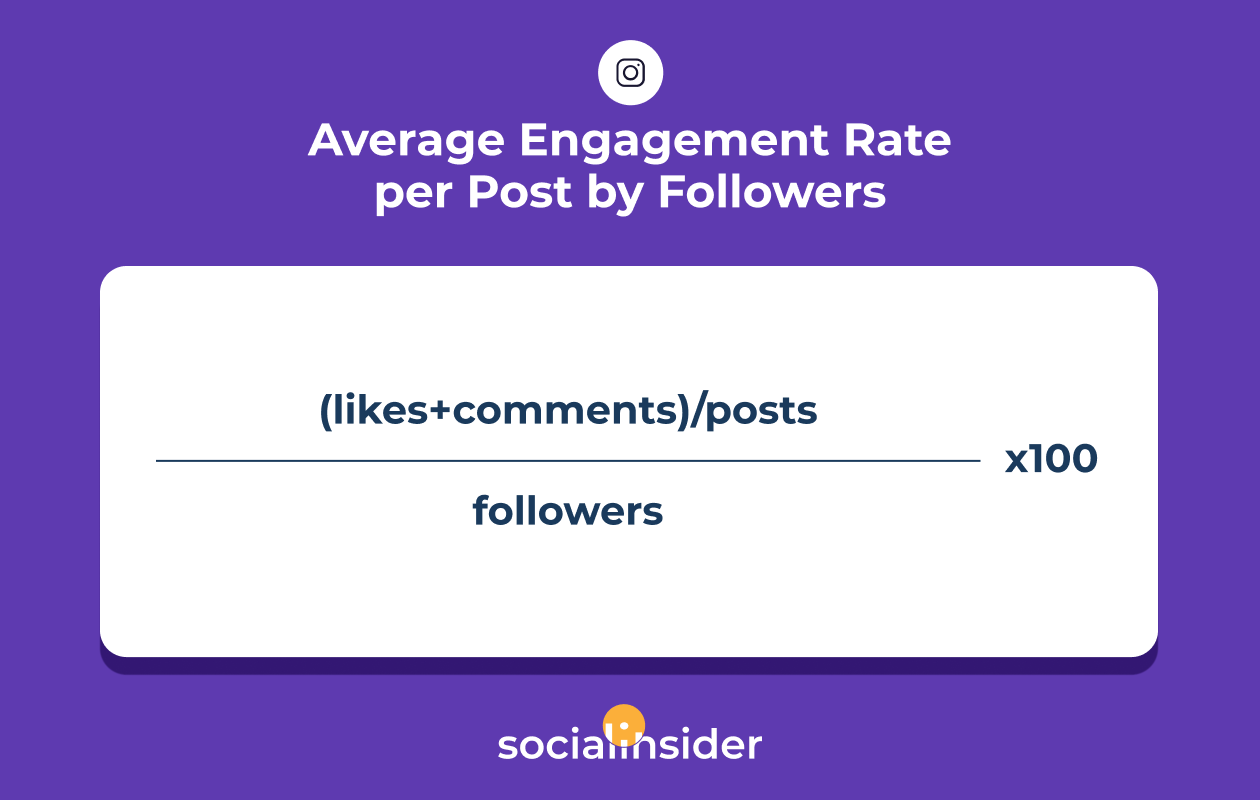
Average engagement rate per post by followers
Any successful marketer knows that they need to keep an eye on several Instagram analytics metrics, but the top priority is engagement.
Here are several ways you can use engagement to analyze your Instagram performance and gain actionable insights.
Look at:
- Total engagement sums up the total number of likes and comments your Instagram profile has received.
- The average engagement is the total engagement of all posts (likes and comments) divided by the total number of posts on your profile. This way, you will find out how involved your audience is.
- The average engagement rate per post by followers is the average engagement divided by the number of followers your page has and then multiplied by 100.
By monitoring analytics on Instagram, you can obtain useful social media insights about your profile, helping you establish marketing strategies that can help your brand elevate.
-
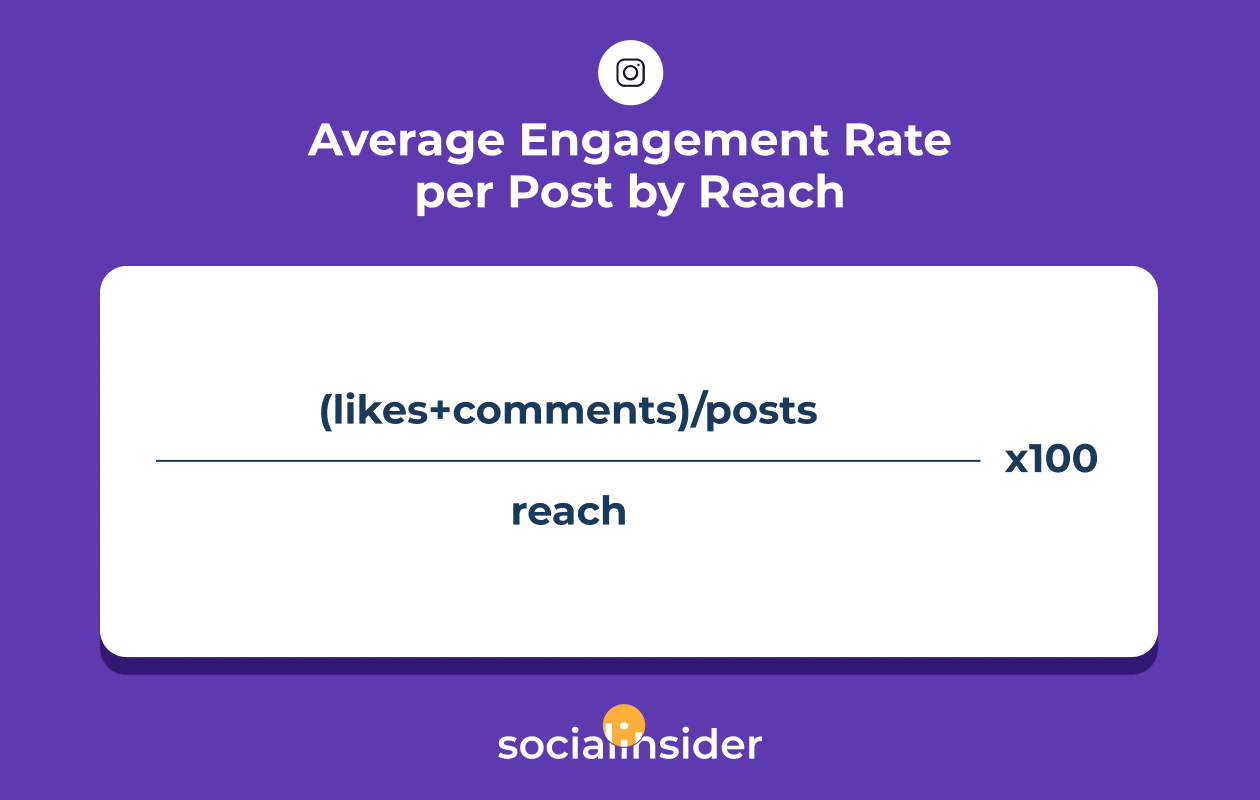
Average engagement rate per post by reach
Most marketing specialists and social media managers use this Instagram insight to visualize their Instagram performance.
The average engagement rate per post by reach is calculated as percentage of likes and comments divided by total number of posts for a specific period of time, all divided by reach.
Instagram analytics shows that engagement rate per post by reach is accurate only for own accounts due to the fact that reach values are not available for competitors.
-
Followers growth on Instagram
The followers growth metric offers marketers a better understanding of the evolution of your Instagram profile over time.
This Instagram metric shows you the ratio between gained followers and the ones you lost. Even if Instagram analytics doesn’t display this number, you can easily find it using an Instagram analytics tool such as Socialinsider.
-
Instagram hashtags
This Instagram insight also measures the effectiveness of your brand’s Instagram strategies.
A useful Instagram analytics tool can display the results and activity of your most used hashtags.
To make sure you use the appropriate Instagram analytics hashtags, you can use a hashtag generator.
This tool will help you find trending hashtags that best suit your brand. Branded hashtags on your profile will increase brand awareness.

This suggests that you should carefully consider what hashtags to use to increase brand awareness.
-
Top posts on Instagram
An app such as Socialinsider can help you discover which are the most engaging posts based on the strategies you have implemented.
Instagram analytics provide statistics and insights that can help you build your future content strategies accustomed to appeal yours and users’ needs.

For instance, if you are using carousel posts and video content and your Instagram statistics show that the most engaging ones are carousels, you should continue using them.
-
Best time to post on Instagram
To find out which is the best time to post on Instagram, you have to think about the time zones of your brand’s followers.
In this way, if you mainly post when they are not online, in order for them to like, share and comment, your posts will have a lower engagement.

For establishing the best posting time, you need to research your audience. To see accurate results, you can either use the native app or an advanced analytics tool like Socialinsider.
Instagram audience analytics
Instagram followers analytics tools can help you obtain information about your viewers and followers.
-
Gender
To find out how to promote your posts best, you need to discover your viewers’ gender distribution.
-
Top locations
This Instagram insight shows you the location of your followers and viewers.
When you notice you have viewers from unexpected countries (that you haven't been targeting), states or cities, you should try to adjust your content to their needs to engage with them even more.
-
Followers evolution
To find out if the content you create is engaging enough to determine users to follow you, you need to check followers’ evolution.
This Instagram followers metric will show you an increase or decrease in the number of followers you have.
-
Language distribution
Another Instagram followers metric which can help you personalize your brand’s content to your viewers’ needs is language distribution.
Finding out which languages your followers speak, will help you establish which language to choose to address them. In this way, they will find it much easier to connect with your content.
-
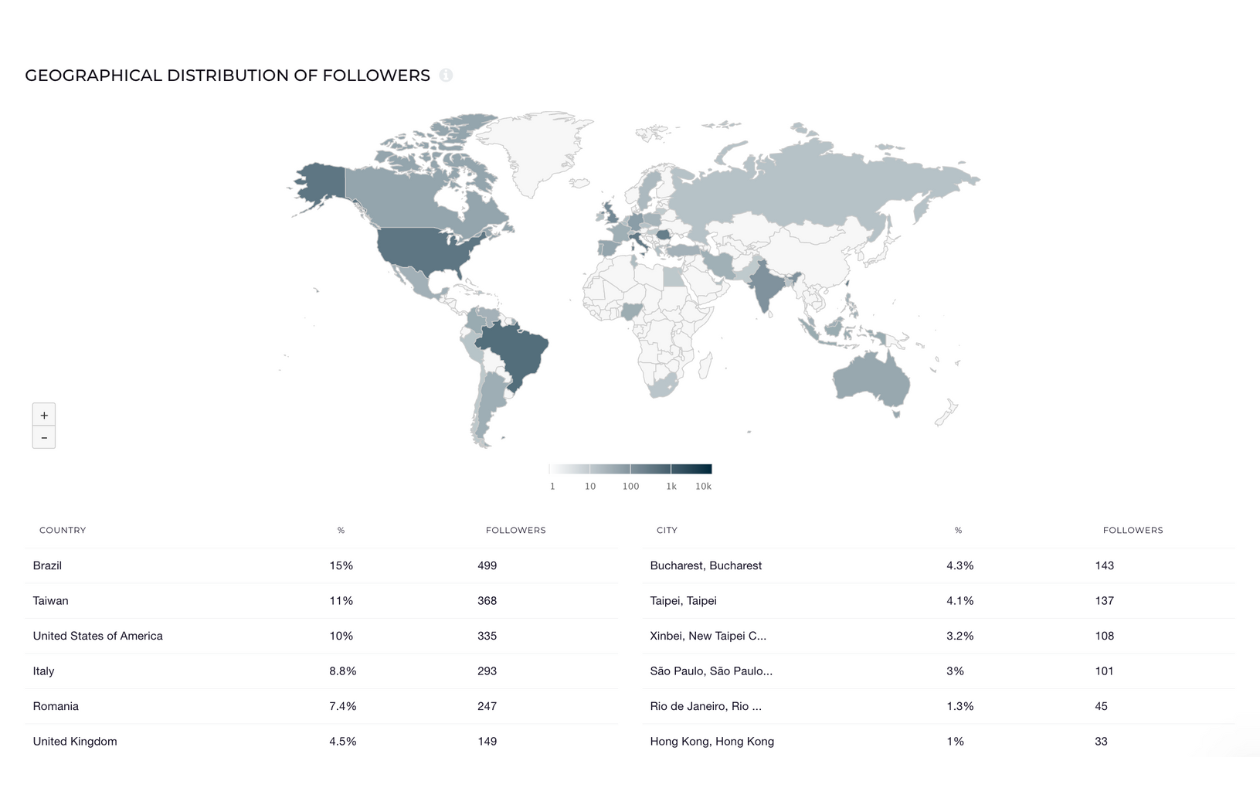
Geographical distribution of followers
To support the language distribution metric, the geographical distribution shows you where your followers come from and the numbers are displayed by percentage.
When you find out where your most engaged audience is located, you can adapt your content, including the posting time and post messages to better suit their needs.
Instagram content analytics
Instagram audience analytics offers you insights about your content in order for you to examine your growth.
-
Likes
Likes represent the total number of likes your content got in a specific amount of time.
-
Comments
This numbers shows how many people have commented on your posts.
-
Saves
This metric offers you insights about the number of viewers who have saved your content in order to review it later on.
-
Instagram calls
Like most social media apps, Instagram also has a call button. You can use this feature from Instagram analytics or any other Instagram insights tool to find out how many phone leads your posts have generated.
-
Instagram emails
The Instagram emails feature from insights shows the total number of emails your brand has received based on followers’ use of the built-in button available on Instagram.
-
Get directions
Instagram audience analytics has a designated feature that measures the number of times a person has requested and gotten instructions on how to physically get to a location referenced in your content. This helps you keep count on walk-inleads.
-
Website clicks
Through the Profile Interactions metric, you can see how many people have messaged, got directions, called or accessed your website directly from your Instagram content.

Instagram Stories analytics
While the previous Instagram analytics are essential for analyzing your Instagram content, what follows focuses only on the metrics you can measure by looking at Instagram Stories.
The insights you get will definitely help you tailor your Stories to suit your viewers’ needs.
-
Story impressions
This metric shows the total number of times a user has seen your Instagram Stories.

-
Story reach
Story reach measures the number of unique users who have seen your Instagram Story. If you also look at Story impressions, you will be able to figure out how many viewers have seen one of your Stories more than once.
This metric can also offer you data about your average story reach, depending on published hour or published day.
-
Tap Forward on stories
This Instagram Stories insight shows you how many people have tapped forward during your Story.
Generally, viewers tend to tap through Stories when they are not engaged with the content you present and they get bored. Your focus should be to maintain this number low by creating on point content.
-
Back Taps on stories
Back taps on Stories is a metric that offers you infos about the number of times a person has gone backward through your Story to view or listen to your content again.
Unlike the tap forward on Stories, a high number of back taps shows that your viewers are engaged and interested in the content you promote.
-
Exits on stories
This metric offers insights on the number of times a viewer has exited your Story before it’s finished. Most of them close the app or tap the “X” to exit Stories.
You would want to keep the exit rate at bay since this shows that your viewers are not engaged. If this rate increases, some followers might stop following you.
-
Replies on stories
This Instagram Stories insight shows the number of DMs you get as a result of a Story.
Your focus should be to have a high rate of replies on Stories because this would mean that your audience is engaged with the content they see.
Nevertheless, if one of your Instagram Stories is considered controversial, you might get a lot of angry messages.
Irrespective of your viewers’ DMs, you need to make sure that the responses you give them will satisfy them.

-
Lives
This Instagram feature has limited support when it comes to Instagram analytics. To better make use of this insight, it’s better to keep count of the number of viewers by yourself.
When you close a Live session, Instagram shows you how many people watched your broadcast after you close it. It is better if you save the number.
-
Story retention rate
The Story retention rate metric displays the number of impressions of the last Story divided by the number of impressions of the first Story within a 24-hour time period.
Instagram Reels analytics
Instagram Reels seem to be here to take over TikTok, its greatest competitor.
-
Views
This metric gives you insights on your video’s total number of plays. This will show you if your videos are exposed and viewed by your audience.
-
Likes
The Likes insight shows how many viewers are interested in your Instagram Reels. This feature displays the total number of likes your posts get from an engaged audience.
-
Comments
This Instagram analytics is extremely useful to measure engagement. If you post Reels that appeal your viewers, then they will generate more engagement.
Instagram ads analytics
There's no point in denying the importance of ads in social media marketing.
To help you shape your strategy, figure out the ROI of your paid social media marketing efforts and take your reporting to a new level, you need accurate data.
Inside the new Paid section of your Instagram analytics dashboard, you can track all the ads you ran and posts you boosted for a selected time range and see how each of them performed in terms of reach, engagement, CTR and more.

3. How to check Instagram analytics using Socialinsider
As we've been showing you, Socialinsider can help you have a deeper understanding of your brand's social media performance on Instagram.
Using our tool, you will always have a dashboard that's packed with valuable metrics, insightful charts and accurate data.
Socialinsider can help you keep an eye on those KPIs which are not provided by native Instagram analytics.

Once you learn how to check Instagram analytics and understand the insights offered, you can start implementing new strategies meant to work for your business and audience.
The statistics and metrics will help you compare your results to those of your competitors to know exactly what your next step should be to get ahead of the rest.
In this way, you will be able to target more users by customizing your content to their needs and your benefit.
Final thoughts
All this information will surely help you figure out how to check Instagram analytics for your brand and leverage that data to improve your performance on social media.
Now it’s your turn.
What Instagram analytics are most useful for measuring your brand performance, and how did you improve your marketing strategy based on them?


