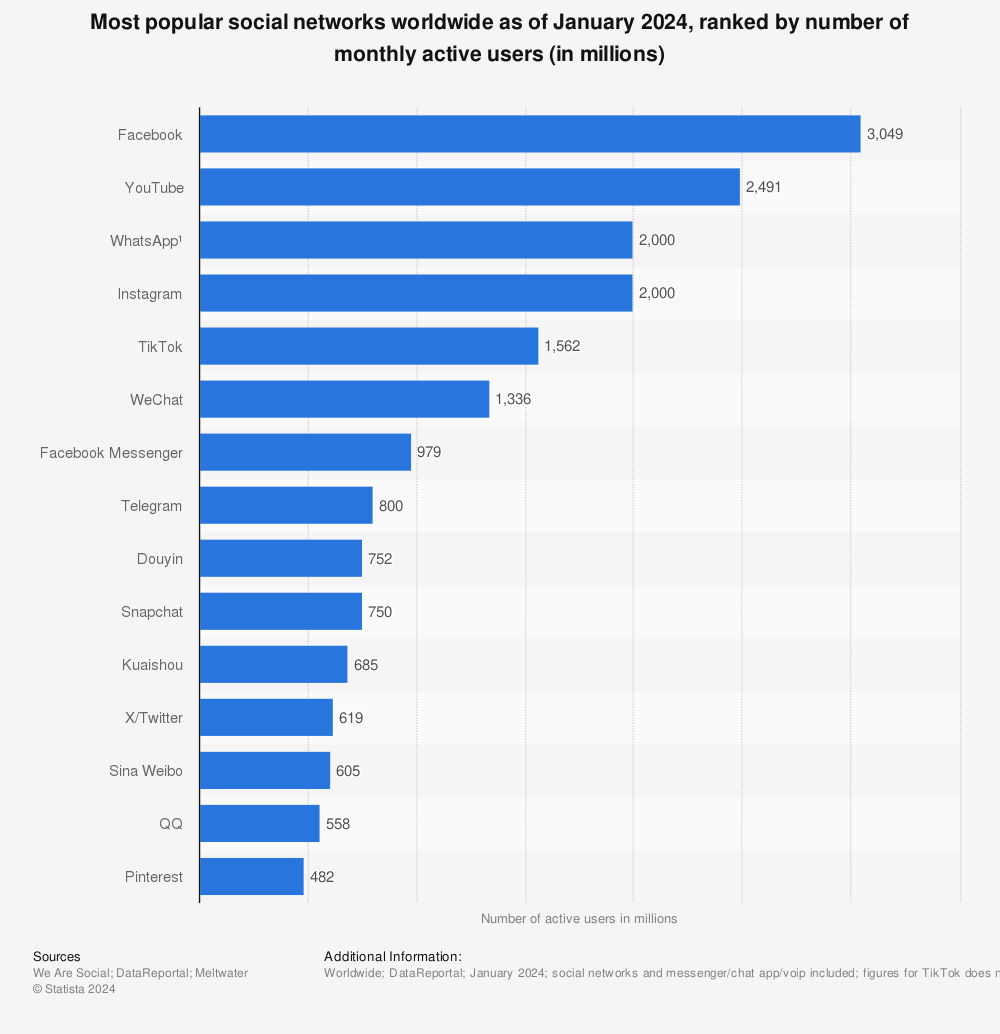
There are currently 2.9 billion people out there who are using Facebook every single day, according to Statista.
Despite the fact that many businesses and brands are jumping on to other social media platforms, Facebook still rules when it comes to social media marketing.
From its powerful advertisement options to Facebook groups, this social media platform has many possibilities businesses should explore.
An active Facebook presence helps you attract potential customers and grow your business, and there's no better way to keep an eye on it than tracking your Facebook metrics.
Let's dive in!
Top 12 Facebook metrics to track in 2023
1. Engagement rate
Facebook engagement rate represents the average number of people who interacted with your post in some way or another: liked, shared, or commented on it.
Building a compelling Facebook account is one thing but creating consistent engagement is a whole other skill that you need to learn.
The average engagement rate per post by followers is calculated as the sum of interactions, comments and shares divided by the number of posts, then all divided by the number of followers and multiplied by 100.
By calculating the average engagement rate, you rule out the outliers.

The average engagement rate per post by reach is calculated by the sum of interactions, comments and shares, divided by the total number of posts and then all divided by your posts' reach.
The result is then multiplied by 100 to obtain a percentage.

Continue reading 👉 Engagement Rate for All Social Media Platforms.
2. Reach
Reach refers to the total number of unique users who have seen your ad or content.
Using this key Facebook metrics insight, you'll see how the content echoes to your audience, and you'll be able to improve your marketing strategy based on your findings.
Facebook Reach is split into types, namely organic and paid.
Social media analytics tools offer more comprehensive information than native apps, such as average reach by type of posts or your page's reach breakdown.

You can also access your reach data in the Meta Business Suite.

It's worth to mention that reach data is one of the top 5 metrics for both social media professionals and clients, according to a survey on social media marketing.
3. Impressions
Facebook impressions metrics represent the numbr of times your ad or content was viewed on a user's screen.
If you want to keep tabs on this Facebook metric to see how many people viewed your content, you can either use Facebook insights or a third-party analytics tool.

You can also check Facebook impressions metric in Facebook Insights by following these steps:
- Go to your Facebook business page
- Spot the "Page Insights" button from your "Manage page" side bar
- Access the "Posts" button located on the left side bar of the screen
- Go to "Reach: Organic/Paid" and switch to "Impressions: Organic/Paid"

Like Reach, Facebook impressions are also split into two main categories:
-
Organic - the Facebook metric that shows how many times your posts have been displayed in people's News Feed for free.
-
Paid - the Facebook metric that counts the number of times people bumped into your content on their pages if you paid for its display.
4. Followers growth
A growing page means you're getting more people liking and interacting with your content.
It's essential not only to measure how many new followers you get but also to know how many followers you have lost in a specific period.
The important thing to keep in mind is that you can track Facebook followers growth only by using a social media analytics tool since this insight is not available in the native app.

From Facebook advertisements to influencer marketing, there are several ways to get new followers to your Facebook page. Eye-candy and bite-size content will always help you attract more Facebook users.
5. Click-Through Rate (CTR)
Click-Through Rate, also known as CTR, can be described as the percentage of people who clicked on a social post and is calculated by dividing the number of link clicks by the number of impressions.

What makes marketers so keen on investing huge budgets into Facebook advertising, it the platform’s high click-through rate results.
Actually, according to data, Facebook is the social media platform that delivers the highest CTR, applied to both organic and paid posts.
When doing social media advertising, social media managers need to keep in mind that in terms of CTR, Facebook ads perform better than Instagram ads, as our last Facebook vs Instagram ads study has revealed.

According to data, Facebook ads’ CTR is actually four times higher than Instagram’s.
When looking at this Facebook metrics and analyzing your Facebook ads strategy, it’s important to understand that optimization on the go is essential, as well as doing in-depth research.
Facebook feed has the highest average CTR, followed by the Facebook video feed.
To really get into the nitty-gritty of data, Facebook CTR stats also show that the least performing types of Facebook ads are the Facebook right column, while Facebook Stories come last.
6. Cost per Click (CPC)
When all is said and done, how much did it cost to get that conversion? Take all the costs of the social media campaign and divide it by the number of clicks you get.
The cost per click metric (also known as CPC) is an important metric you should keep an eye on if you’re doing Facebook ads.

As many brands invest tremendous budgets into Facebook ads, an in-depth view of your Facebook ads metrics is mandatory for a complete, bulletproof Facebook strategy report.
Also, Facebook video feeds have a lower CPC than the one of Facebook feed or Facebook right column.
7. Cost per Thousand Impressions (CPM)
If you want to build brand awareness, the Facebook metrics you should closely analyze is CPM (cost per mille).
CPM is the amount you pay every time a thousand people scroll past your sponsored social media content.

Our new study on Facebook Ads shows some useful CPM insights for marketers. Facebook feed has the highest average CPM, followed by Facebook video feeds.
The next that comes in line is Facebook Stories, while the lowest CPM is found for the Facebook right column ad.
8. Best time to post
You may think Facebook posts are welcomed by users anytime, primarily because the notification bar exists, and your followers can find your new content in their feed.
However, to make sure all eyes are on you as soon as you hit the publish button, you should check which is the best time to post on Facebook.

If you take advantage of this Facebook metric, your traffic may double. Social media studies have proved that Facebook users are more likely to interact with posts on Friday when most people relax for the weekend.
Statistics show that on Fridays, there are 17% more comments, 16% more likes, and 16% more shares. During the week, the best time to post is between 1-4 PM.
Moreover, content posted on weekends can register an increase of 25% in the engagement rate compared to those published during weekdays, based on a new study.
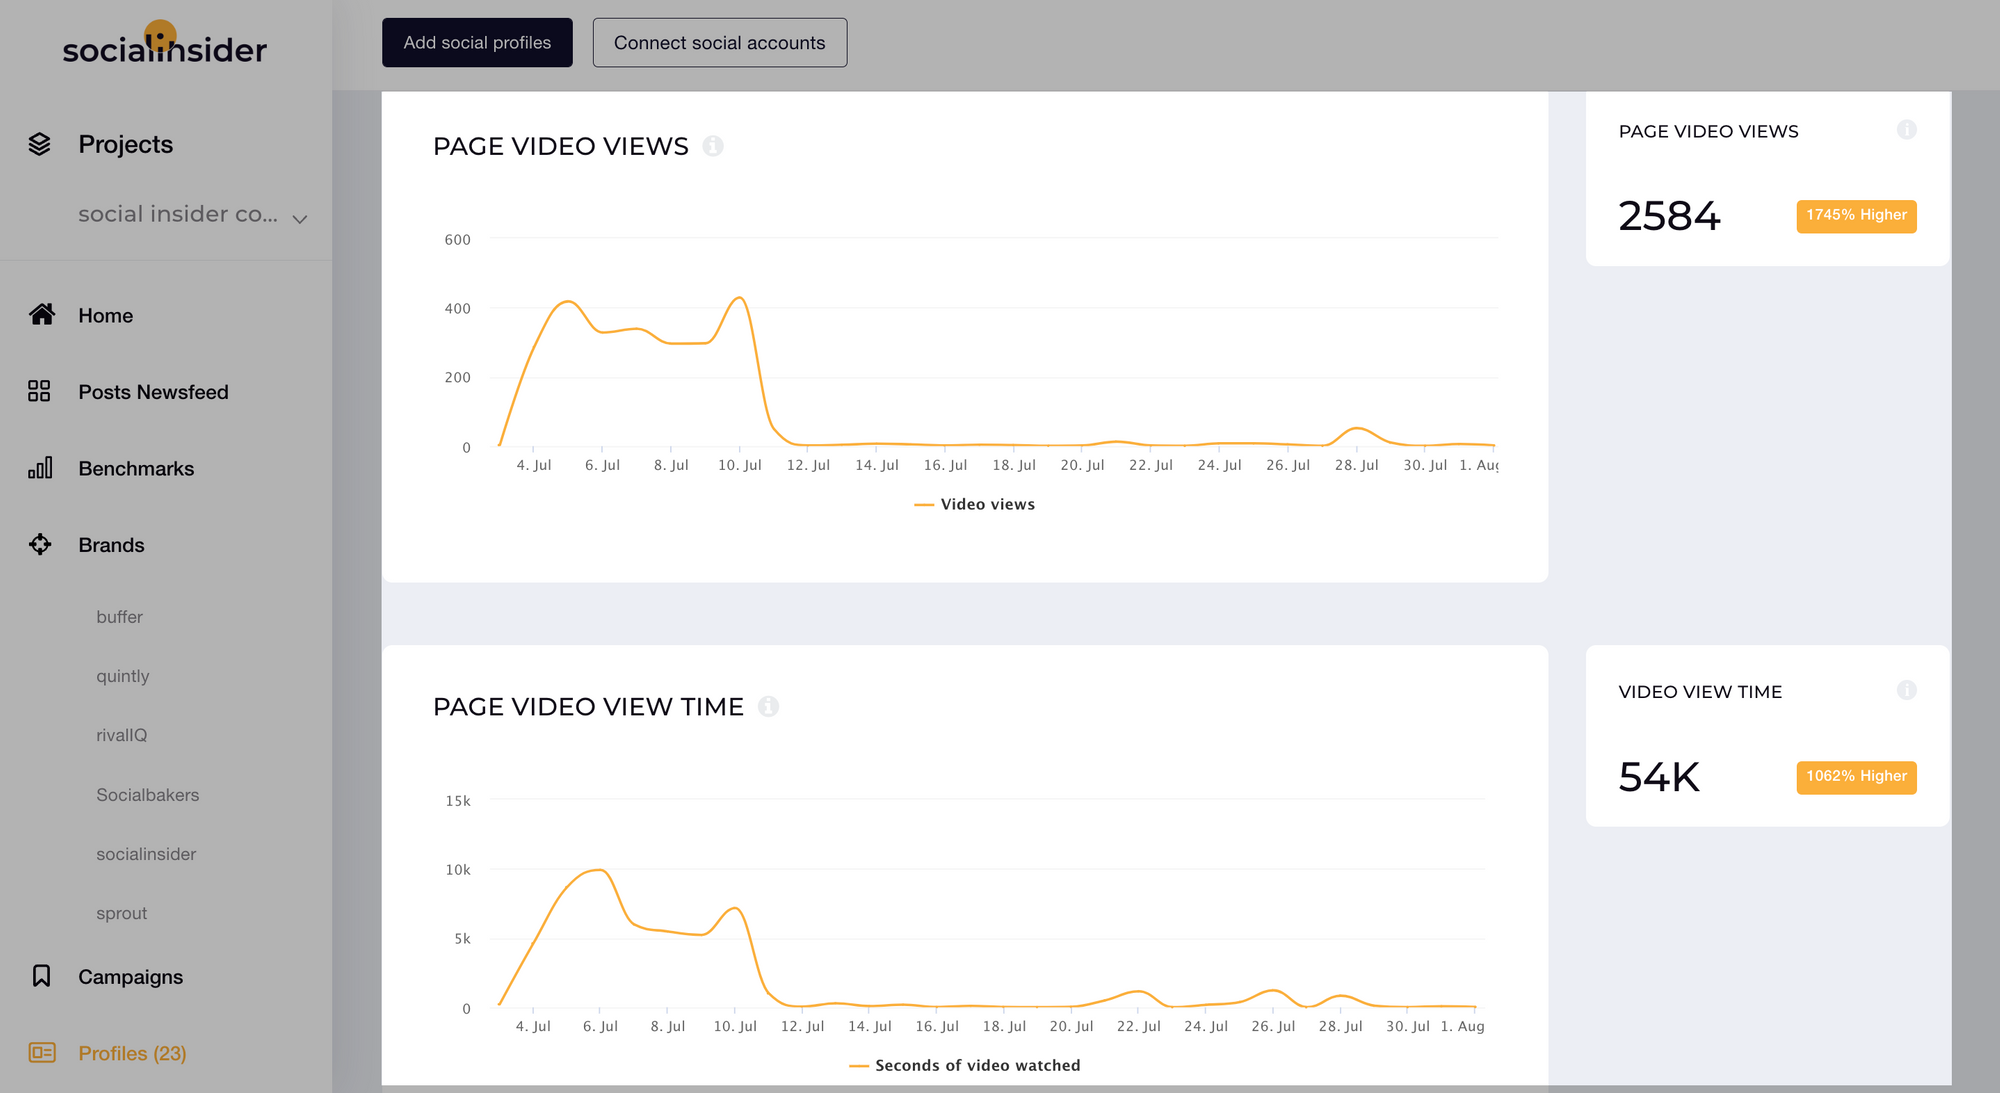
9. Video views
A picture is worth a thousand words, but videos are way more important in today's social media strategy.
If you're using Facebook videos to promote your business, tracking your video views is a must.
This Facebook video metric will show you how engaging your video content is. A video view is taken into account after users sees the first 3 seconds of your video posts.
When using Facebook Insights, you have two options: to see your videos overall performance or to see individual video metrics.
Apart from using Facebook's native analytics to see your brand's evolution, you can always use another analytics tool for more insights.
If you are using this type of content to promote your business, you should know that vertical videos outperform landscape videos in engagement, according to Socialinsider's Facebook study.
10. Audience retention
Audience retention is a Facebook metric that is part of Facebook video analytics. This metric shows how long a user watched one of your videos.
This way, you will determine with which videos your followers engaged more.
This Facebook metric contributes to changing your social media strategy if you discover that a particular type of video is more suitable for your audience.
When a video has low audience retention, it means it’s too long or the content is not engaging enough.
You may need to alter the length and, in some cases, also the content of your videos.
Video retention refers to "the amount of time viewers spend watching the videos you publish to your Page," according to Facebook.
This Facebook metric tells you how long a video keeps (or retains) a viewer's attention.
It's really important to keep an eye on this key metric because it can help you better understand how long people are watching your videos and what point they tend to stop watching them.
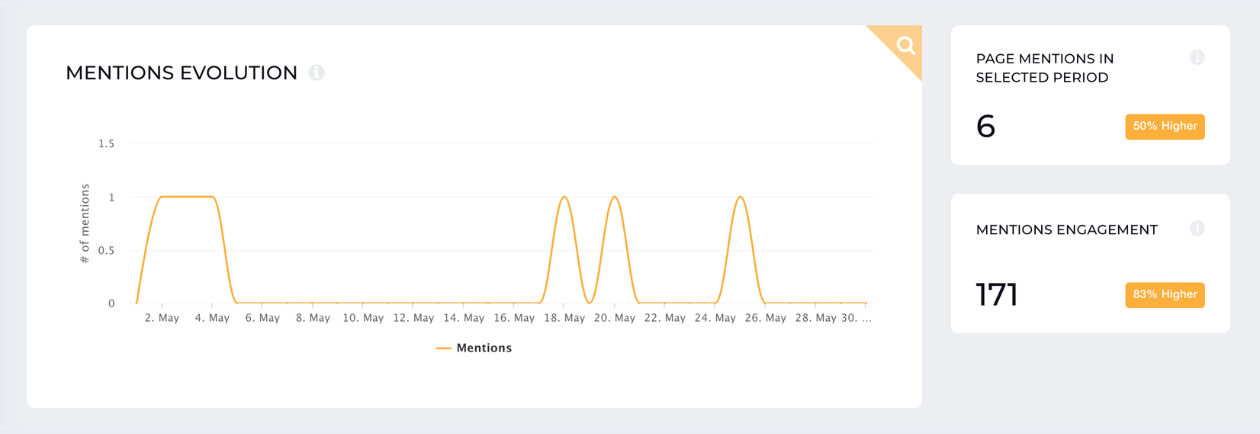
11. Mentions
Looking at Facebook mentions is a key part of your social media analysis helps you figure out who mentions your brand and how much engagement these brand mentions are generating.
You can monitor Facebook page mentions in Socialinsider, directly from your Facebook analytics dashboard.
12. Followers demographics
Understanding where your audience comes from allows you to shape your tone of voice, message, and customize the content to your followers specific requirements.
You can do this by looking at the follower demographics such as gender, location (country or even city), and education.
Worldwide, 9.3% of the total active Facebook users are young women between 18 and 24 years old, and 13.3% of them are male users from the same age category, according to Statista.

Having this in mind, you can create your Facebook strategy to attract young people and to create content they can relate to.
However, it's important to put your own demographic first.
If your demographic consists of people over 25, or even over 30, keep the bulk of your content curated for that specific age group, while also including some posts meant to attract the younger segment.
Final thoughts
Knowing your target audience is the first step to develop your social media marketing strategy. But this is not enough. Creating valuable content also needs consistent monitoring.
To recap, these are the most important Facebook metrics your brand should track in 2023:
- Engagement
- Reach
- Impressions
- Followers growth
- CTR
- CPC
- CPM
- Best time to post
- Video views
- Audience retention
- Mentions
- Followers demographics